Fig. 13
Download original image
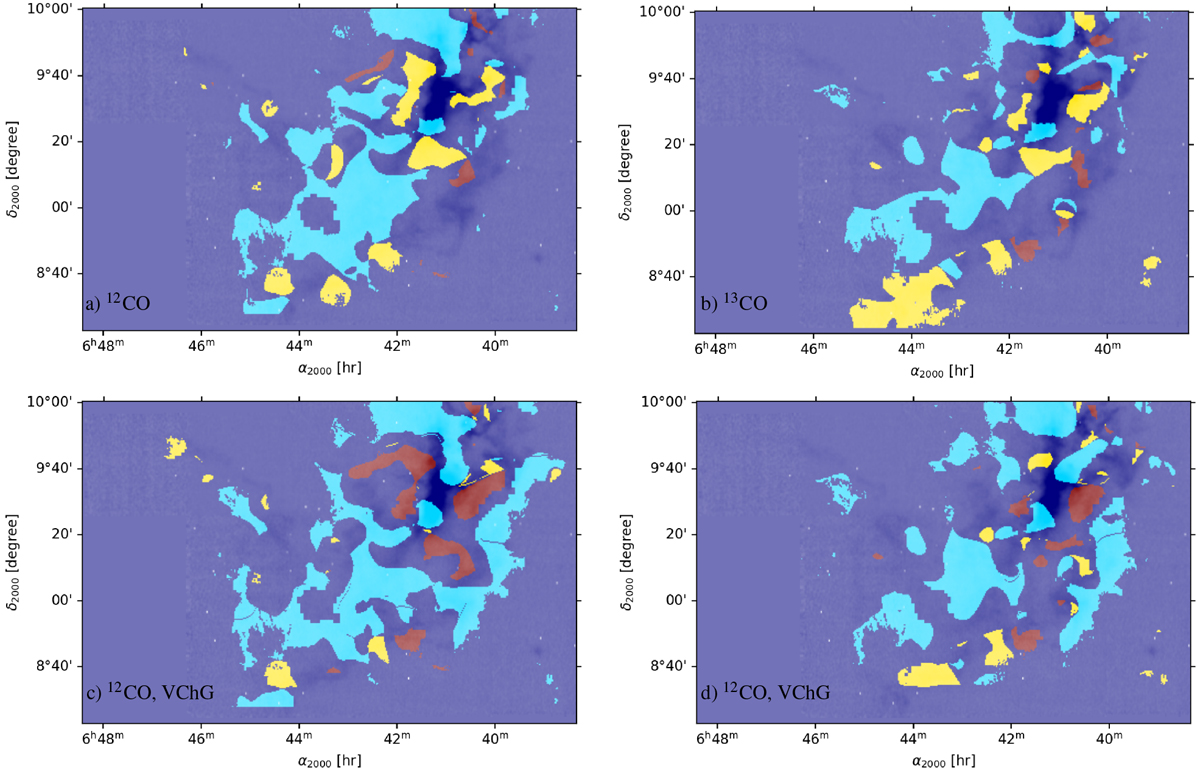
Southern part of Mon OB 1 east. The blue shaded patterns correspond to the regions where gravity is not dominant (case i), the red shaded patterns correspond to the candidate collapsing regions (case ii), and the yellow shaded patterns correspond to the candidate shock regions (case iii), overlaid on the 13CO integratedintensity grey scale map. Top row: based on the comparison between the velocity gradients, intensity gradients and the POS magnetic field direction derived from Planck: (a) based on 12CO data; (b) based on 13CO data. Bottom row: based on the comparison between the velocity channel gradients, intensity gradients and the POS magnetic field direction derived from Planck: (c) based on 12CO data; (d) based on 13CO data.
Current usage metrics show cumulative count of Article Views (full-text article views including HTML views, PDF and ePub downloads, according to the available data) and Abstracts Views on Vision4Press platform.
Data correspond to usage on the plateform after 2015. The current usage metrics is available 48-96 hours after online publication and is updated daily on week days.
Initial download of the metrics may take a while.