Fig. 1
Download original image
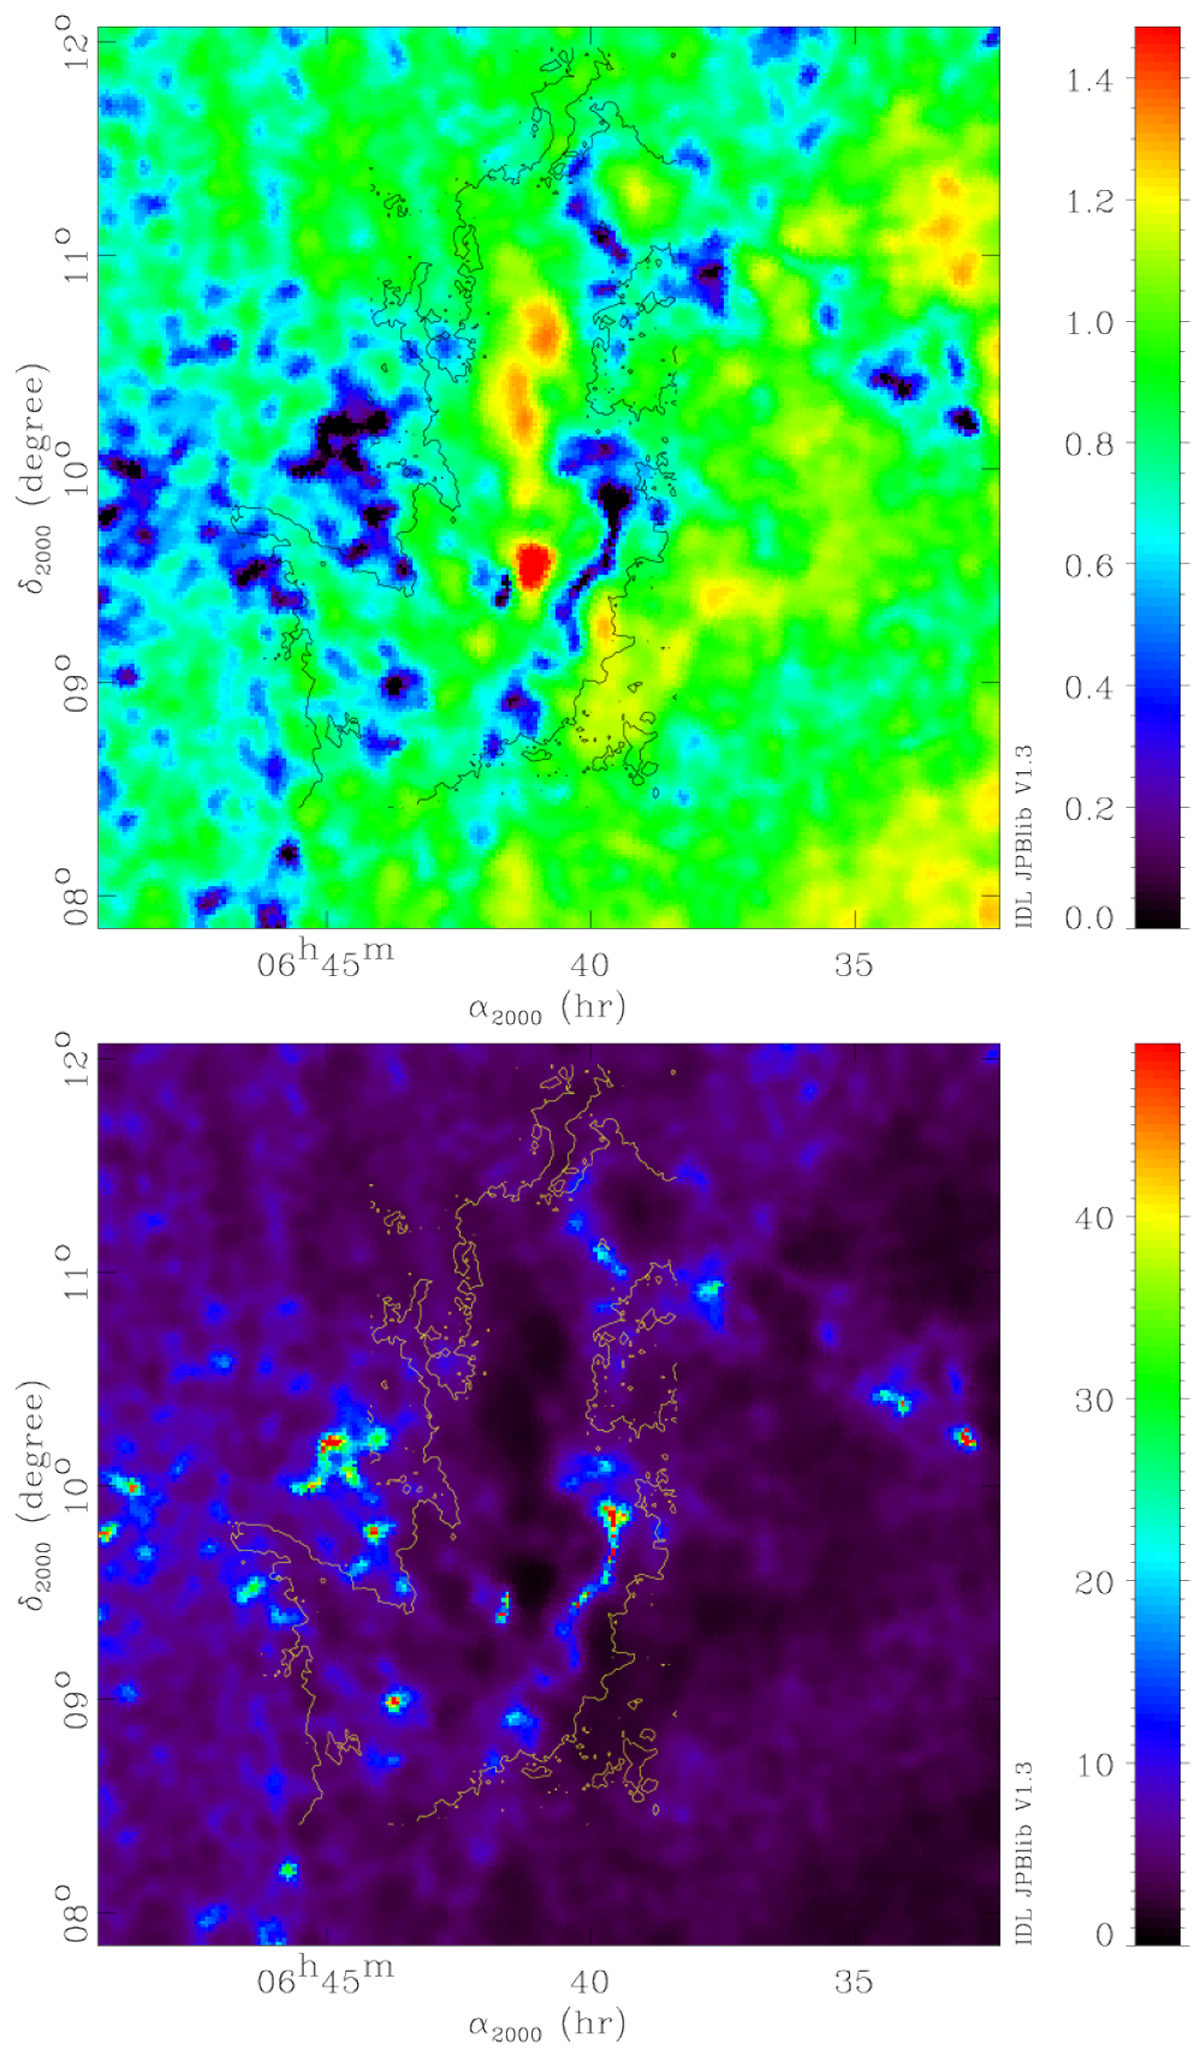
Assessment of the data quality. Top: S/N of the polarization. Colour scale shows log10 (p∕σp). Bottom: dispersion of the polarization angle σψ in degrees. Both are estimated using Bayesian analysis of the Planck data. Contours correspond to the value of 2 K km s−1 of the 12CO integrated intensity, represented in the right panel of Fig. 3.
Current usage metrics show cumulative count of Article Views (full-text article views including HTML views, PDF and ePub downloads, according to the available data) and Abstracts Views on Vision4Press platform.
Data correspond to usage on the plateform after 2015. The current usage metrics is available 48-96 hours after online publication and is updated daily on week days.
Initial download of the metrics may take a while.