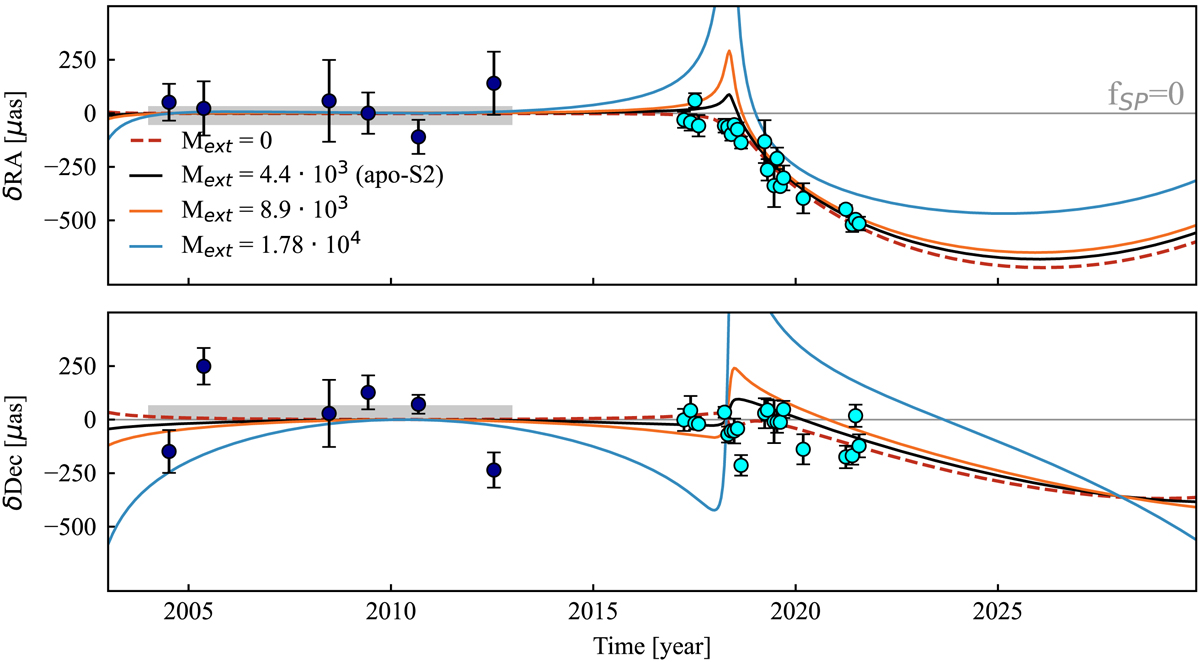
Fig. C.2.
Download original image
Same data and RA-/Dec-residual plots as the left panels in Figure 3, with the dashed red curve denoting the fSP = 1 GR curve for the best fitting orbit and mass. In addition, we show orbital models with the same central mass, distance and orbital parameters but now adding an extended mass component assumed to have a Plummer shape (Gillessen et al. 2017) showing the impact of adding a Plummer mass of Mext within the 0.25″ apocenter radius of S2. Black, orange and blue solid curves show the changes expected if this extended Plummer mass is 0.1, 0.3 and 0.6% of M• (4.4 × 10³, 8.9 × 10³ and 1.78 × 10⁴M⊙ within the apocenter of S2, Rapo = 0.24″). Formal fitting shows that such an extended mass greater than about ≈0.1% of M• is incompatible with the data.
Current usage metrics show cumulative count of Article Views (full-text article views including HTML views, PDF and ePub downloads, according to the available data) and Abstracts Views on Vision4Press platform.
Data correspond to usage on the plateform after 2015. The current usage metrics is available 48-96 hours after online publication and is updated daily on week days.
Initial download of the metrics may take a while.