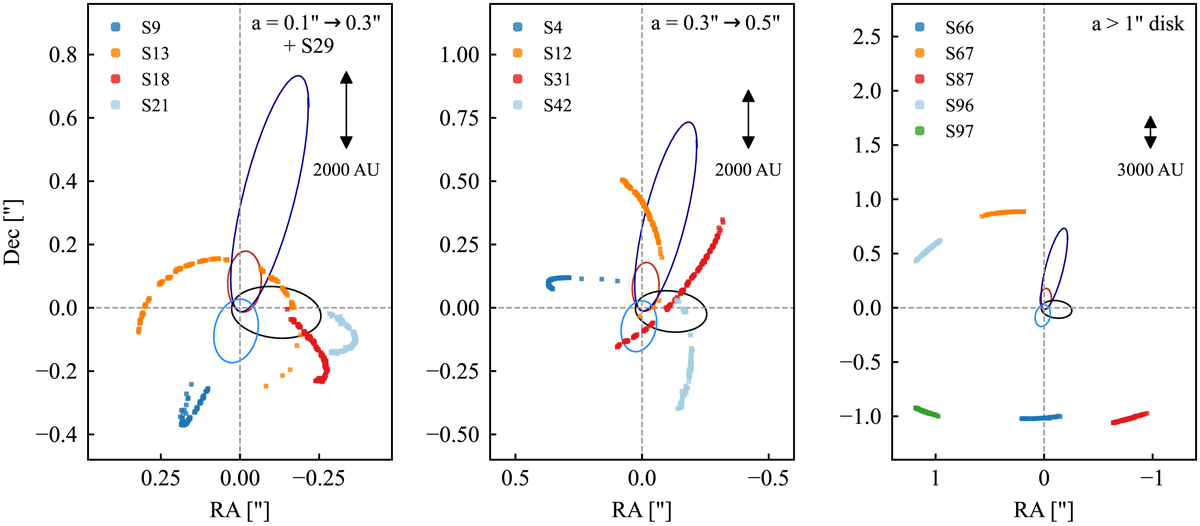
Fig. C.1.
Download original image
Visualization of the orbital (astrometric) data used in determining the mass distribution in the GC. The panels group the stars according to the semi-major axes of their orbits, as indicated in the top left in each panel. For reference, we show in each panel the orbits from the four-star fit (S2: red line, S29 violet, S38 black, S55 blue), Left: Orbital data for S9, S13, S18 and S21. Middle: S4, S12, S31 and S42. Right: S66, S67, S87, S96 and S97. These data are complemented by multi-epoch spectroscopy for the orbital fitting.
Current usage metrics show cumulative count of Article Views (full-text article views including HTML views, PDF and ePub downloads, according to the available data) and Abstracts Views on Vision4Press platform.
Data correspond to usage on the plateform after 2015. The current usage metrics is available 48-96 hours after online publication and is updated daily on week days.
Initial download of the metrics may take a while.