Fig. 4.
Download original image
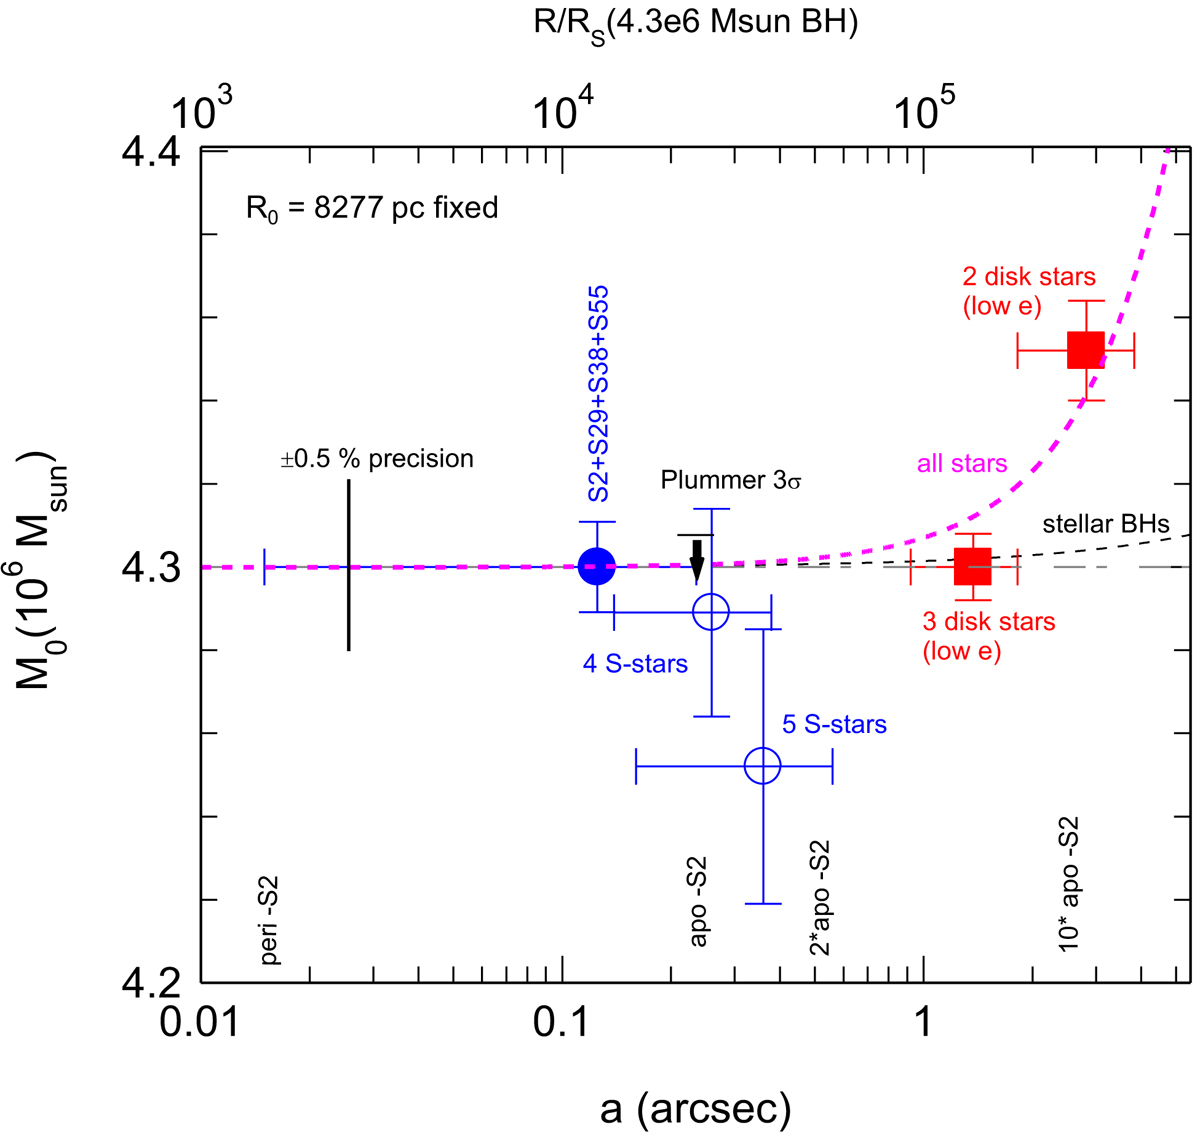
Summary of the central mass distribution in the GC, within 20× the apocenter radius of the S2 orbit, ≈5″. The filled blue circle is the central mass of 4.30 × 10⁶ M⊙ (for R0 = 8277 pc, and its 1σ uncertainty of 12 000 M⊙), which our four-star fitting has established to lie within the 1200RS pericenter of S29. The black arrow denotes the 3σ upper limit of Mext(≤0.3″) of the sum of M• and any extended Plummer mass of assumed scale radius 0.3″. The two open blue circles and two red filled squares show averages of enclosed masses within the semi-major axes of other S-stars and clock-wise disk stars. The magenta dashed line is the sum of M• and the extended stellar mass distribution from the literature (e.g., Genzel et al. 2010; Alexander 2017; Schödel et al. 2018; Baumgardt et al. 2018). All data are in excellent agreement with a point mass (the MBH Sgr A*) and a star cluster with a power-law density slope γ ≈ 1.6 (Genzel et al. 2003; Gallego-Cano et al. 2018), consisting of main-sequence stars and a small contribution of giants. No extra component from dark matter or an intermediate mass black hole > 103 M⊙ (GRAVITY Collaboration 2020) is required or compatible with the data.
Current usage metrics show cumulative count of Article Views (full-text article views including HTML views, PDF and ePub downloads, according to the available data) and Abstracts Views on Vision4Press platform.
Data correspond to usage on the plateform after 2015. The current usage metrics is available 48-96 hours after online publication and is updated daily on week days.
Initial download of the metrics may take a while.