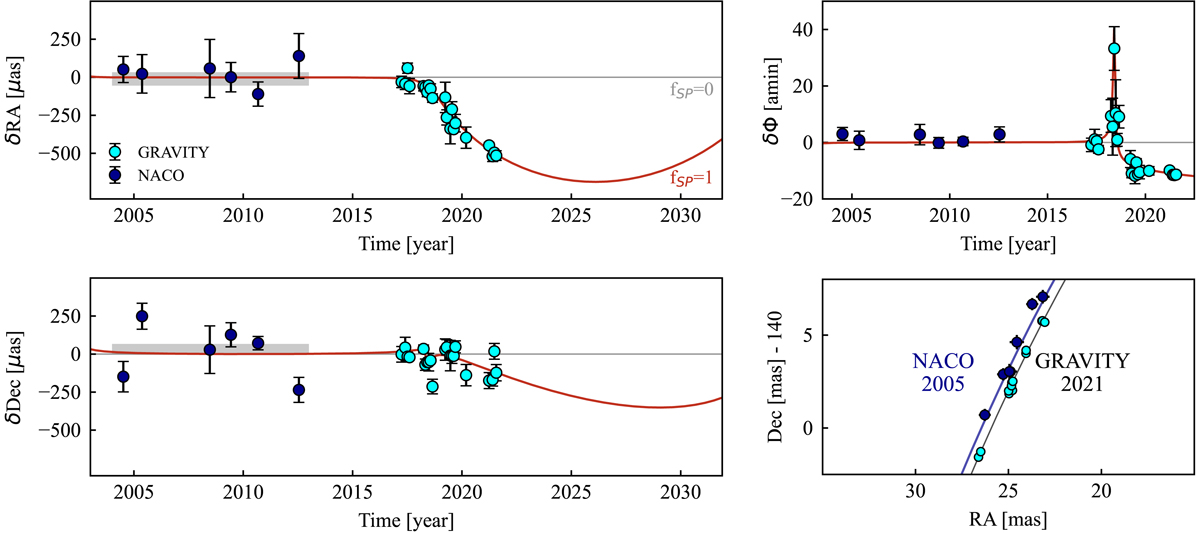
Fig. 3.
Download original image
Illustration of the fit results for fSP. We show the key figures for S2. Two left panels: the residuals in RA (top) and Dec (bottom) between the GRAVITY (cyan filled circles, and 1σ uncertainties) and NACO data (blue filled circles) and the best GR fit (red curve, fSP = 1, Rømer effect, plus special relativity, plus gravitational redshift and Schwarzschild precession), relative to the same orbit for fSP = 0 (Kepler/Newton, plus Rømer effect, plus special relativity, plus redshift). The orbital elements for non-Keplerian orbits (i.e., with fSP ≠ 0) are interpreted as osculating parameters at apocenter time, 2010.35. NACO and GRAVITY data are averages of several epochs. The grey bars denote averages over all NACO data near apocenter (2004–2013). Top right: the same for the residual orbital angle on the sky δϕ = ϕ(fSP = 1)−ϕ(fSP = 0). Bottom right: zoom into the 2005/2021 part of the orbit, plotted in the mass rest frame. The earlier orbital trace does not coincide with the current one due to the Schwarzschild precession.
Current usage metrics show cumulative count of Article Views (full-text article views including HTML views, PDF and ePub downloads, according to the available data) and Abstracts Views on Vision4Press platform.
Data correspond to usage on the plateform after 2015. The current usage metrics is available 48-96 hours after online publication and is updated daily on week days.
Initial download of the metrics may take a while.