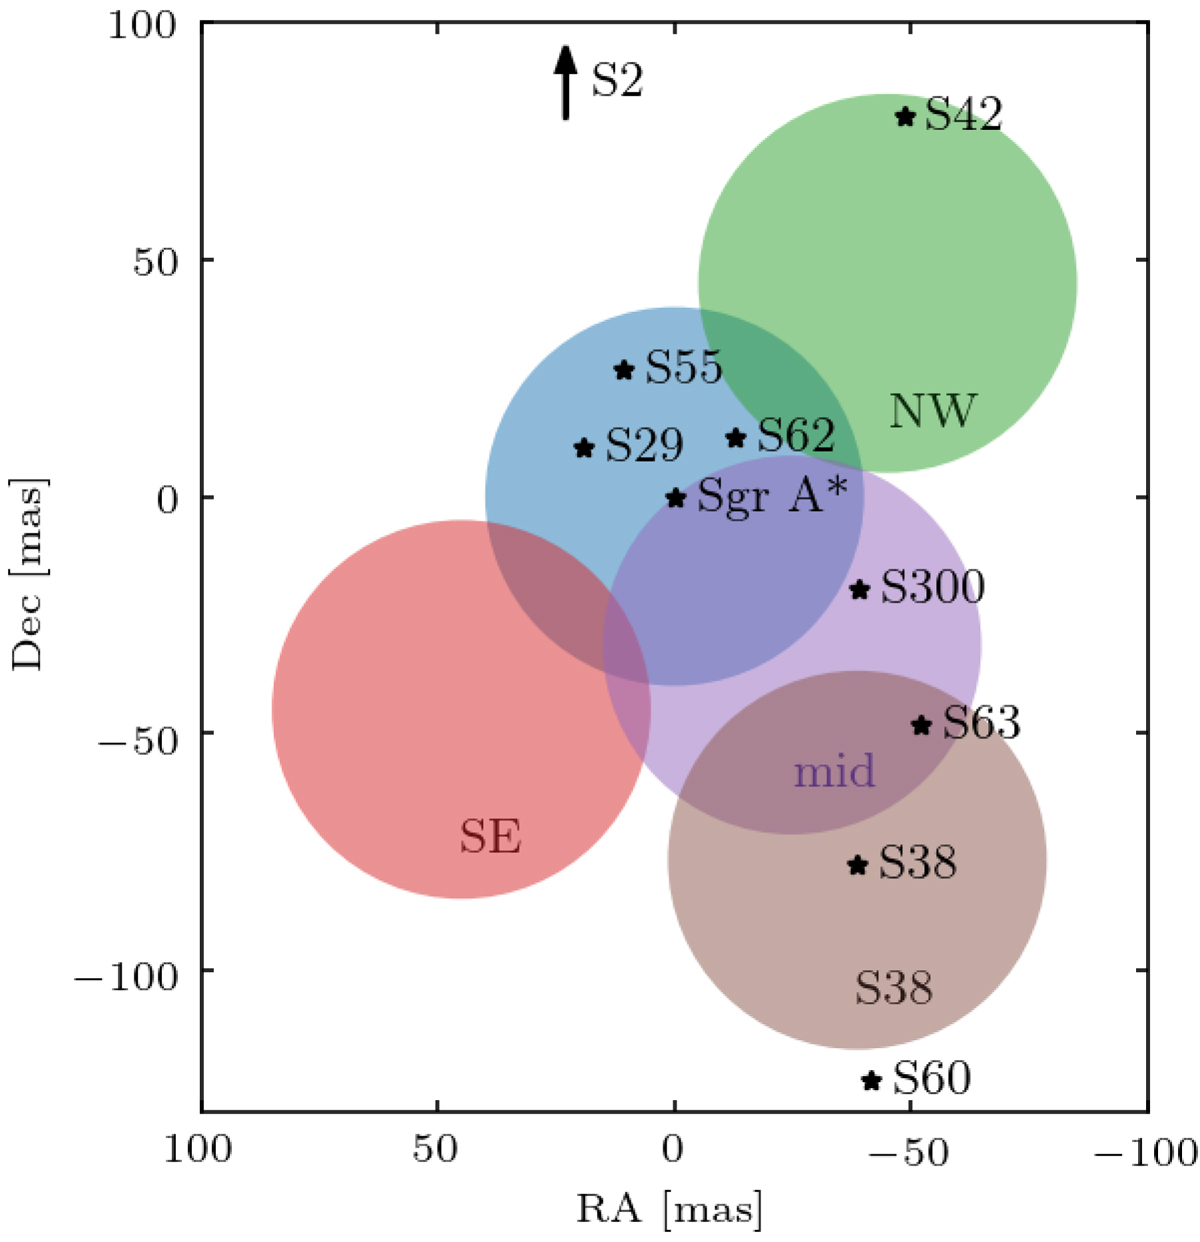
Fig. 4.
Download original image
Summary of pointings in the mosaicing data set in the relation to the positions of all detectable stars during the July observing run. For completeness, we further include the Sgr A*-centered exposures (blue). Colored circles indicate the individual pointings and have diameters of 40 mas, which is half the extent of the images in Fig. 5.
Current usage metrics show cumulative count of Article Views (full-text article views including HTML views, PDF and ePub downloads, according to the available data) and Abstracts Views on Vision4Press platform.
Data correspond to usage on the plateform after 2015. The current usage metrics is available 48-96 hours after online publication and is updated daily on week days.
Initial download of the metrics may take a while.