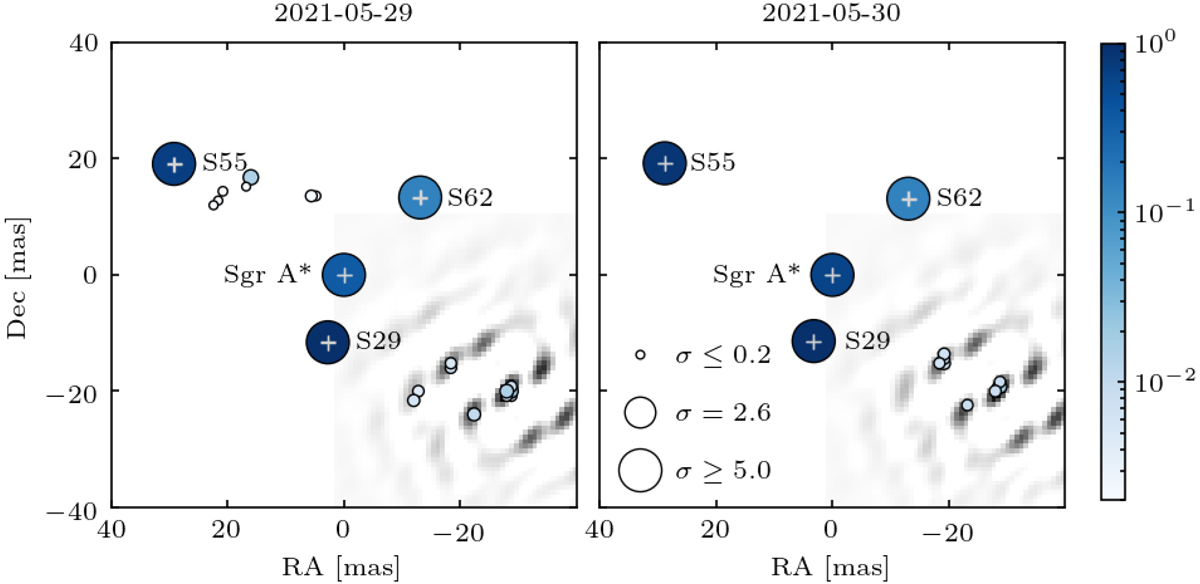
Fig. 2.
Download original image
Combined view on all imaging runs from a single night (see Appendix E for details on the illustration). The symbol color indicates the flux of a source candidate, normalized to S29, while the symbol size represents its significance. The Sgr A* flux depicted here has to be multiplied by the light curve at each exposure to arrive at the true flux ratio. For stars that are modeled as a point source, the position uncertainty is indicated in gray. Sources are shown superimposed on the dirty beam pattern of the imaging night, which we have centered at the position of S300.
Current usage metrics show cumulative count of Article Views (full-text article views including HTML views, PDF and ePub downloads, according to the available data) and Abstracts Views on Vision4Press platform.
Data correspond to usage on the plateform after 2015. The current usage metrics is available 48-96 hours after online publication and is updated daily on week days.
Initial download of the metrics may take a while.