Fig. F.1.
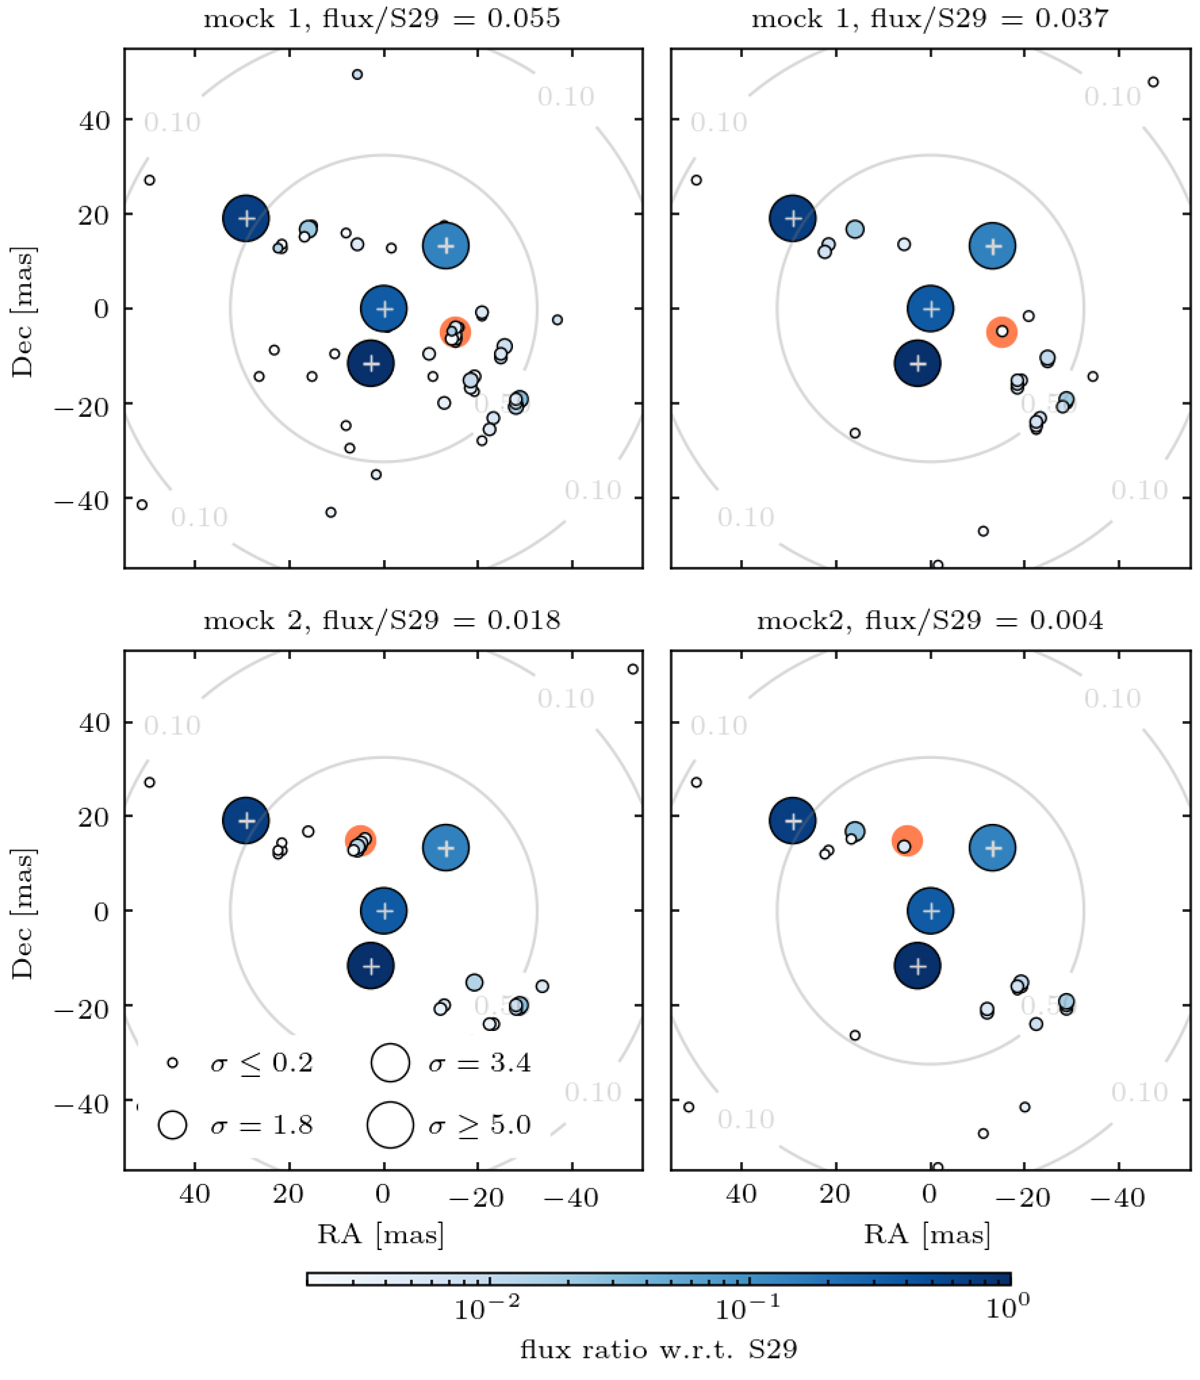
Download original image
Results of injection tests for the May 29 data set. The position of the injected source is at ( − 15.0, −5.0) mas from Sgr A* for mock 1, at (5.0, 15.0) mas for mock 2 and marked by an orange circle in the respective plots. We show the combined samples from ten imaging runs with varying random seed and indicate the mean inferred flux, normalized by S29, by symbol color and the significance of a source candidate by the size of its symbol (see Appendix E for details). In this fashion of display, variation of a faint source’s position by a pixel between the imaging runs leads to a decrease in the estimated significance, even if the detection is very robust (> 5σ) for individual runs. The Sgr A* flux depicted here has to be multiplied by the light curve at each exposure to arrive at the true flux ratios. For stars that are modeled as a point source, the position uncertainty is indicated in gray.
Current usage metrics show cumulative count of Article Views (full-text article views including HTML views, PDF and ePub downloads, according to the available data) and Abstracts Views on Vision4Press platform.
Data correspond to usage on the plateform after 2015. The current usage metrics is available 48-96 hours after online publication and is updated daily on week days.
Initial download of the metrics may take a while.