Fig. 3.

Download original image
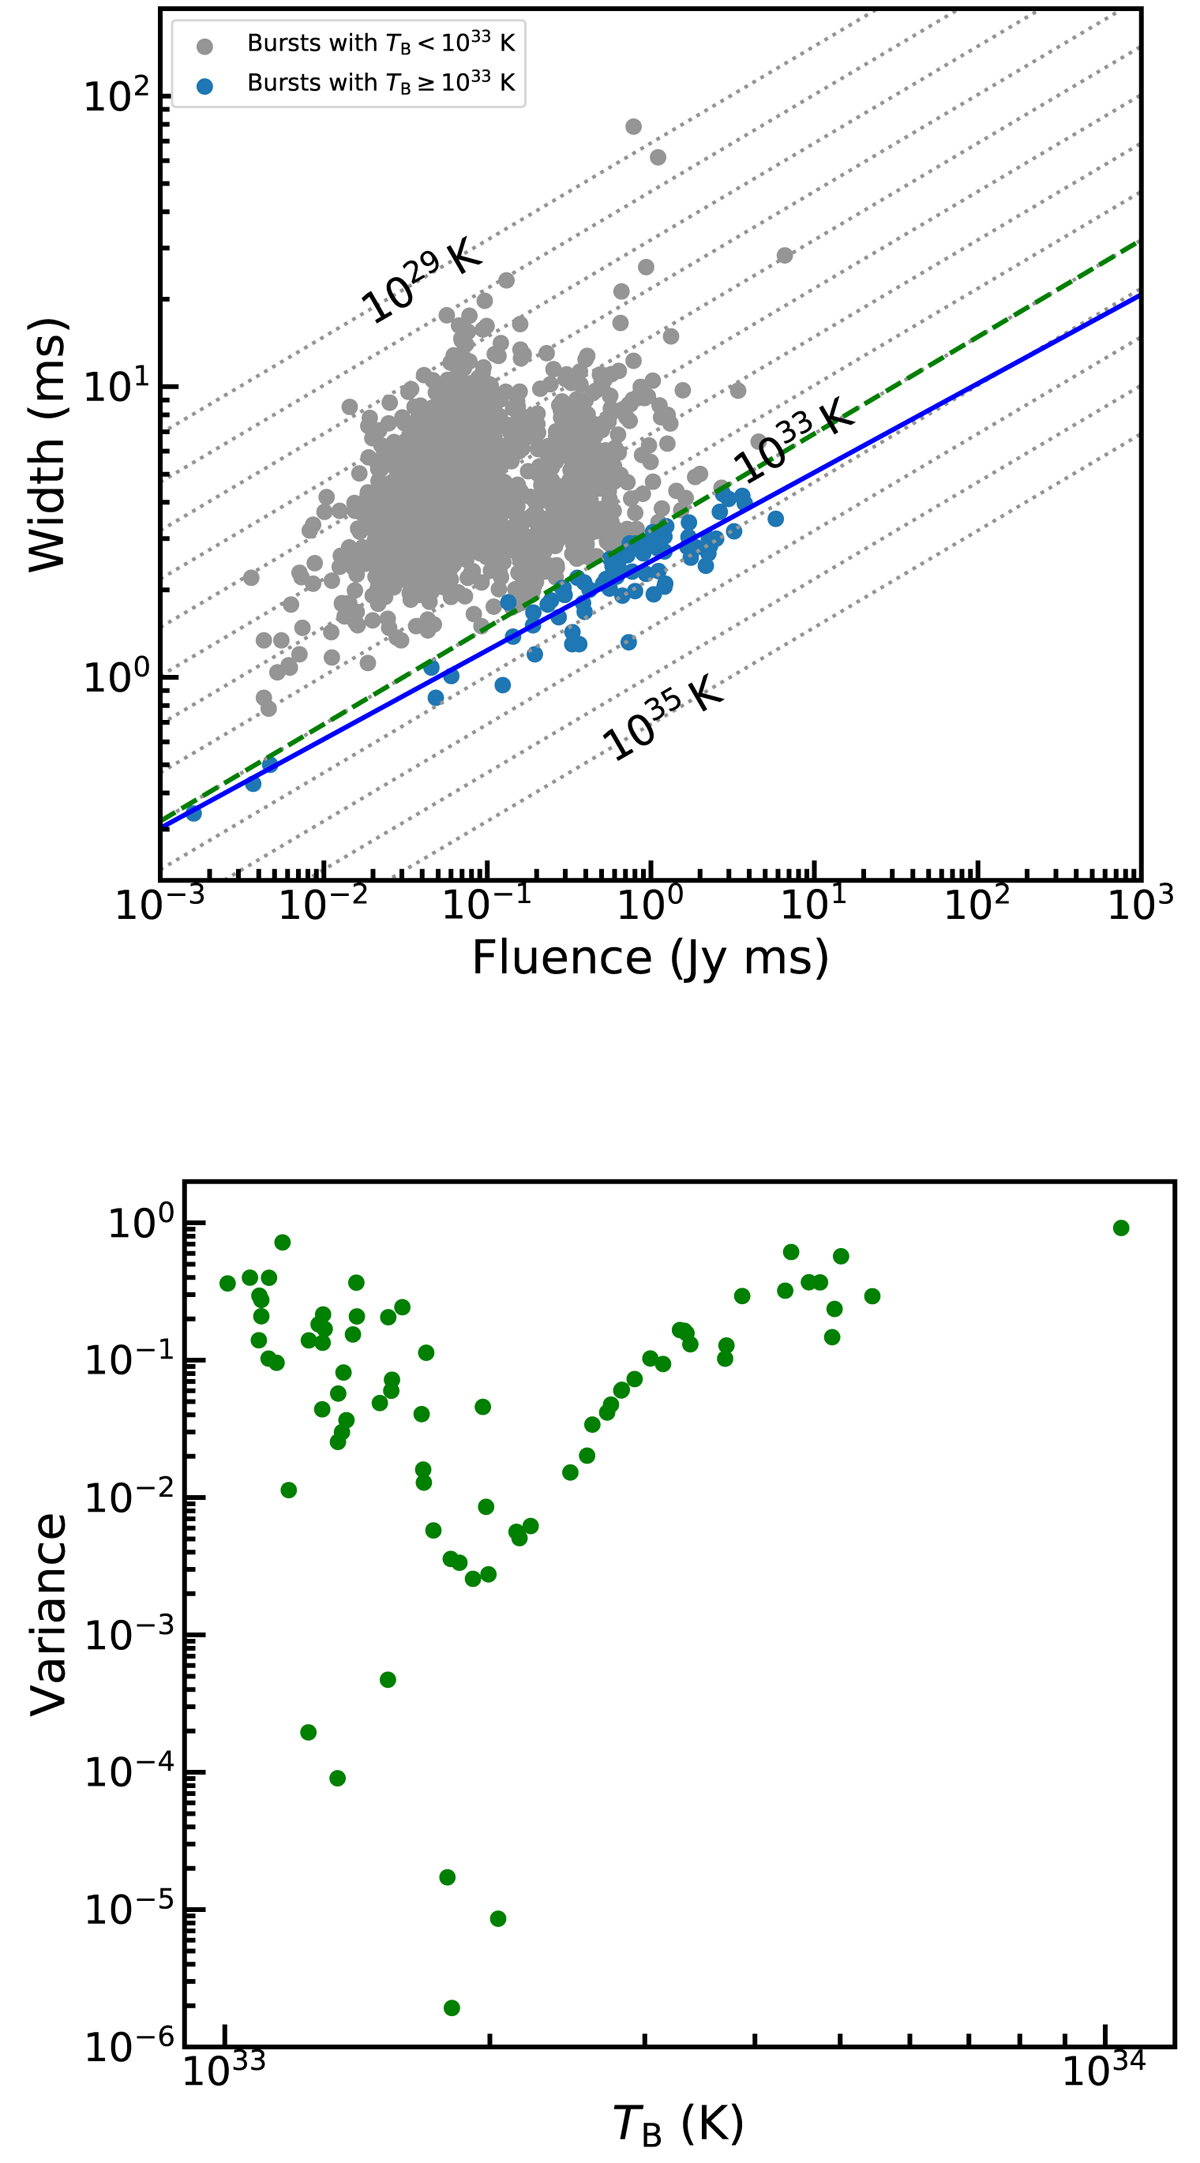
Scatter plot of pulse width versus fluence for the full FAST sample, in which 76 “classical” bursts are marked with colored dots (upper panel). The blue solid line represents the best-fitting of ![]() . The dotted lines represent for different fixed TB values and the green dashed line is for the critical 1033 K. The variance of 76 bursts with respect to the fitting line versus their brightness temperatures (lower panel) and no clear dependence is found.
. The dotted lines represent for different fixed TB values and the green dashed line is for the critical 1033 K. The variance of 76 bursts with respect to the fitting line versus their brightness temperatures (lower panel) and no clear dependence is found.
Current usage metrics show cumulative count of Article Views (full-text article views including HTML views, PDF and ePub downloads, according to the available data) and Abstracts Views on Vision4Press platform.
Data correspond to usage on the plateform after 2015. The current usage metrics is available 48-96 hours after online publication and is updated daily on week days.
Initial download of the metrics may take a while.


