Fig. 6
Download original image
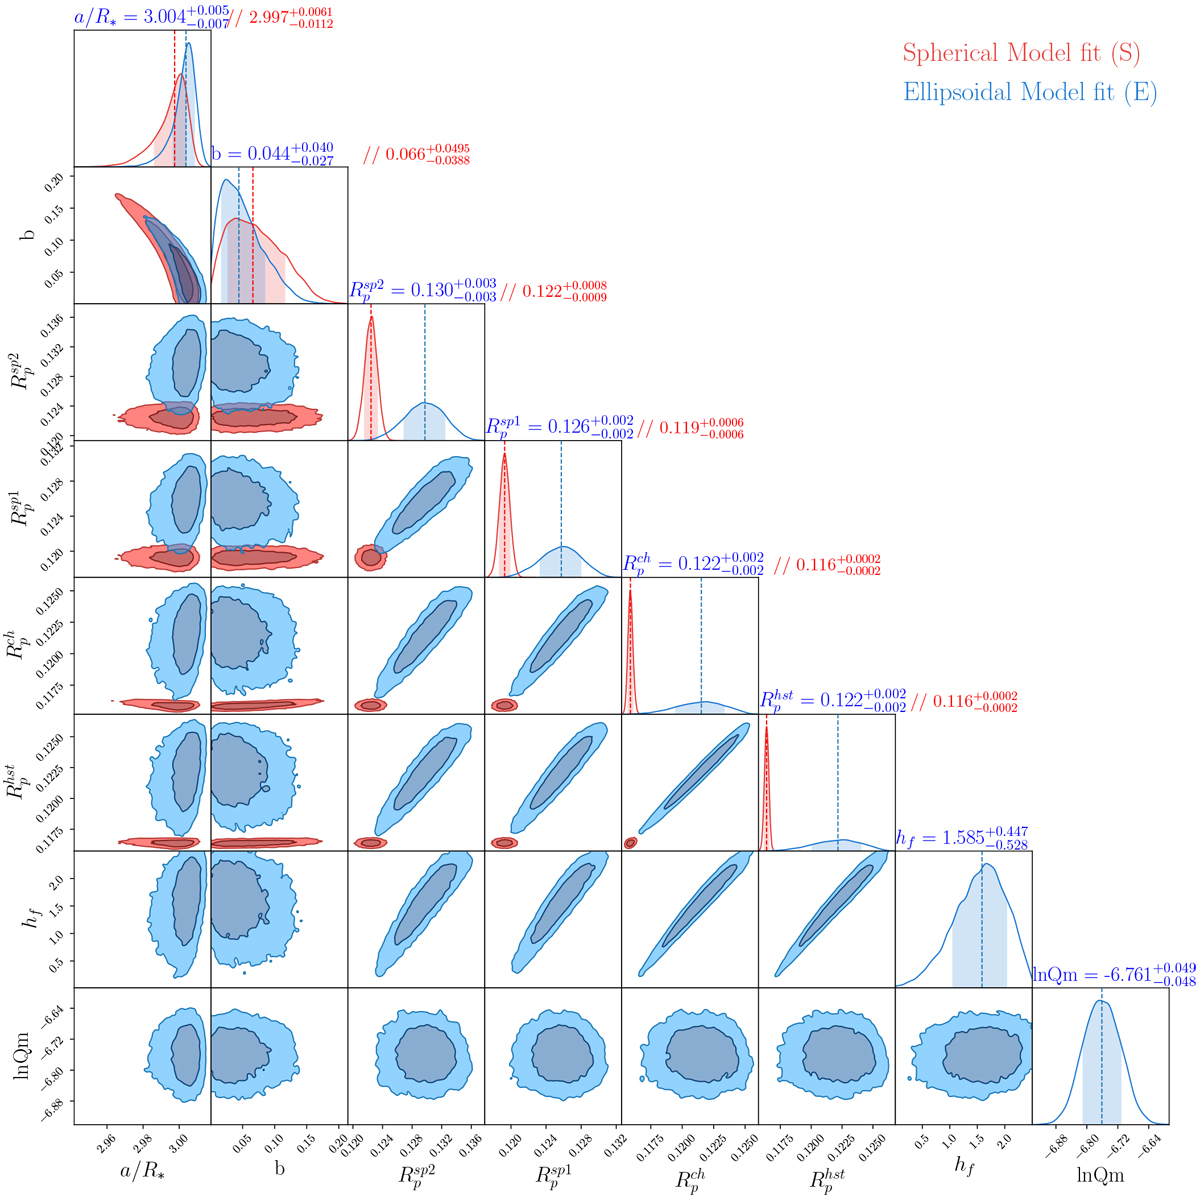
Derived correlation plots and posterior probability distributions of the transit parameters of WASP-103b for the spherical (red) and ellipsoidal model (blue). The vertical lines show the median of the distributions and the shaded area shows the 68% confidence intervals. We show the 1 σ (dark blue and dark red) and 2 σ (light blue and light red) contours. We obtained a 3 σ detection of the Love number. The parameter distributions also clearly show that the ellipsoidal model is not as well constrained as the spherical model due to strong correlations between the Love number and the radius ratio. For the ellipsoidal model, the radius ratio refers to the volumetric radius. The superscripts sp1, sp2, ch, and hst refer to the two Spitzer channels, CHEOPS, and HST, respectively.
Current usage metrics show cumulative count of Article Views (full-text article views including HTML views, PDF and ePub downloads, according to the available data) and Abstracts Views on Vision4Press platform.
Data correspond to usage on the plateform after 2015. The current usage metrics is available 48-96 hours after online publication and is updated daily on week days.
Initial download of the metrics may take a while.