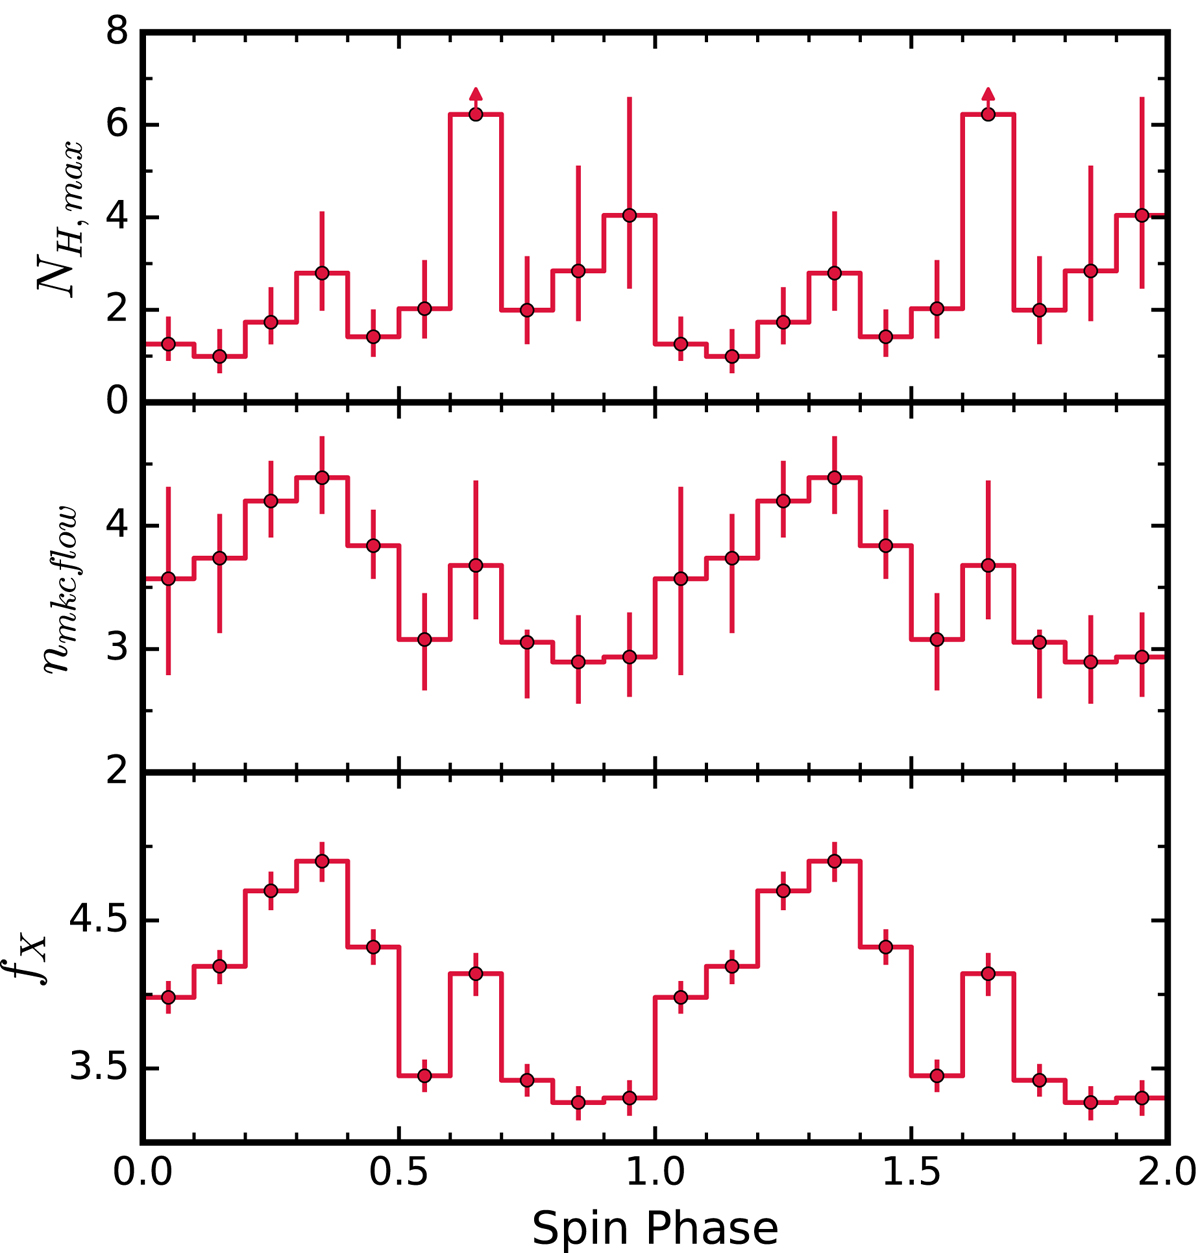
Fig. 8.
Download original image
Variations of the best-fit spectral parameters as a function of spin phases. From top to bottom, the panels show the variation in the maximum equivalent hydrogen column NH, max, the normalization of the MKCFLOW model (nmkcflow), and the unabsorbed X-ray flux (fX) in the 0.5–78.0 keV energy band. The unit of all parameters is similar as described in Table 3. Error bars are plotted within a 90% confidence limit for a single parameter.
Current usage metrics show cumulative count of Article Views (full-text article views including HTML views, PDF and ePub downloads, according to the available data) and Abstracts Views on Vision4Press platform.
Data correspond to usage on the plateform after 2015. The current usage metrics is available 48-96 hours after online publication and is updated daily on week days.
Initial download of the metrics may take a while.