Fig. 5.
Download original image
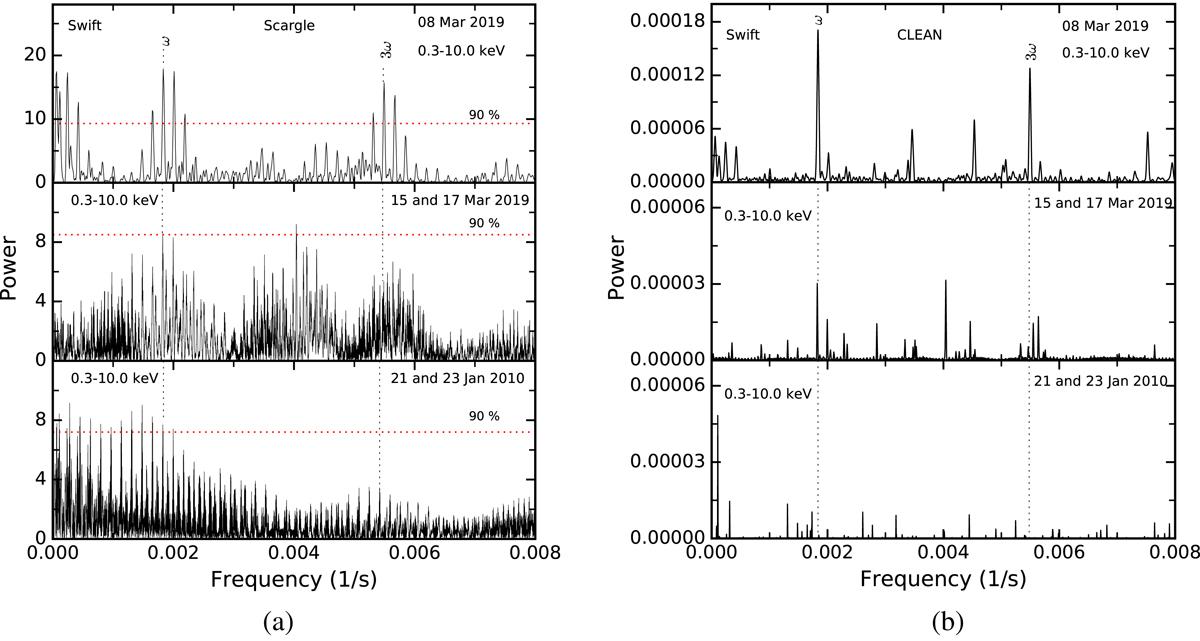
(a) Lomb-Scargle and (b) CLEANed power spectra of IGR1654. From top to bottom, the panels show the X-ray power spectra obtained from the Swift observations for the epochs 08 Mar 2019, 15 and 17 Mar 2019, and 21 and 23 Jan 2010 in the 0.3–10.0 keV energy band, respectively. The red horizontal dotted lines represent the 90% confidence level.
Current usage metrics show cumulative count of Article Views (full-text article views including HTML views, PDF and ePub downloads, according to the available data) and Abstracts Views on Vision4Press platform.
Data correspond to usage on the plateform after 2015. The current usage metrics is available 48-96 hours after online publication and is updated daily on week days.
Initial download of the metrics may take a while.