Fig. 5
Download original image
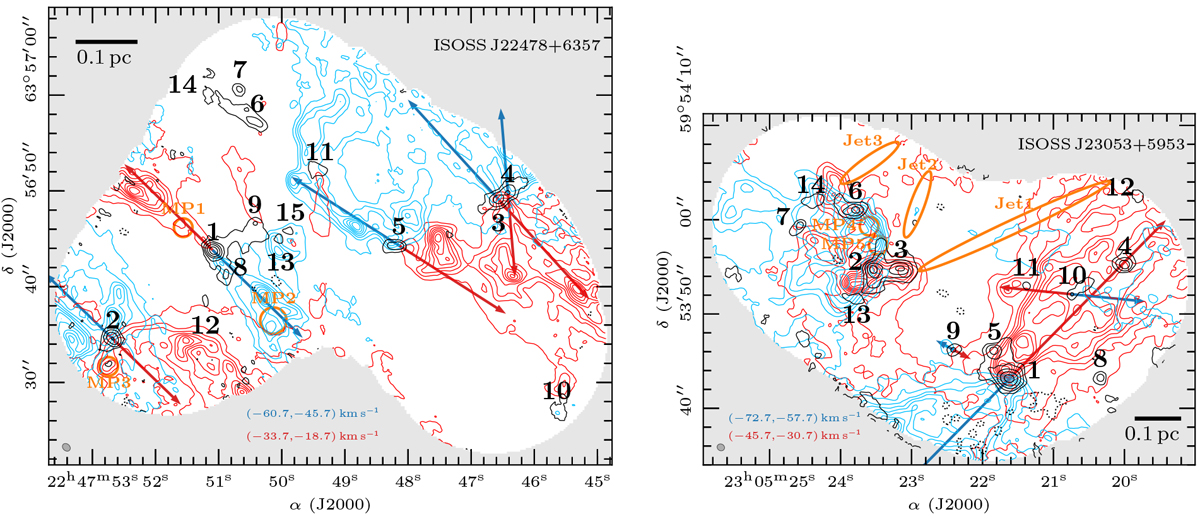
CO 2−1 outflows in ISOSS J22478+6357 (left panel) and ISOSS J23053+5953 (right panel). The blue and red contours show the integrated intensity of the blue- and red-shifted line wings, respectively. The intensity is integrated over vLSR − 21 to vLSR − 6 and over vLSR + 6 to vLSR + 21 km s−1 for the blue- and red-shifted integrated intensity, respectively. The corresponding velocity ranges are shown in each panel. Contour levels range from 10 to 90% of the peak integrated intensity with steps of 10%. In ISOSS J22478+6357 the red- and blue-shifted peak integrated intensity is 45 and 47 K km s−1 and in ISOSS J23053+5953 it is 112 and 140 K km s−1, respectively. Red- and blue-shifted outflow directions are indicated by red and blue arrows, respectively. The NOEMA 1.3 mm continuum data are shown in black contours. The dotted black contour marks the − 5σcont level. Solid black contour levels are 5, 10, 20, 40, and 80σcont. All mm cores identified in Beuther et al. (2021) are labeled in black. Positions with a peak in molecular emission, but no associated continuum (“molecular peaks”, MP) are indicated by orange circles (Sect. 4.2.1). Jet-like structures, seen in SiO 5− 4 emission, are indicated by orange ellipses (Fig. 7). The synthesized beam of the continuum data is shown in the bottom left corner. The synthesized beam of the spectral line data is similar. A linear spatial scale of 0.1 pc is indicated bya black scale bar.
Current usage metrics show cumulative count of Article Views (full-text article views including HTML views, PDF and ePub downloads, according to the available data) and Abstracts Views on Vision4Press platform.
Data correspond to usage on the plateform after 2015. The current usage metrics is available 48-96 hours after online publication and is updated daily on week days.
Initial download of the metrics may take a while.