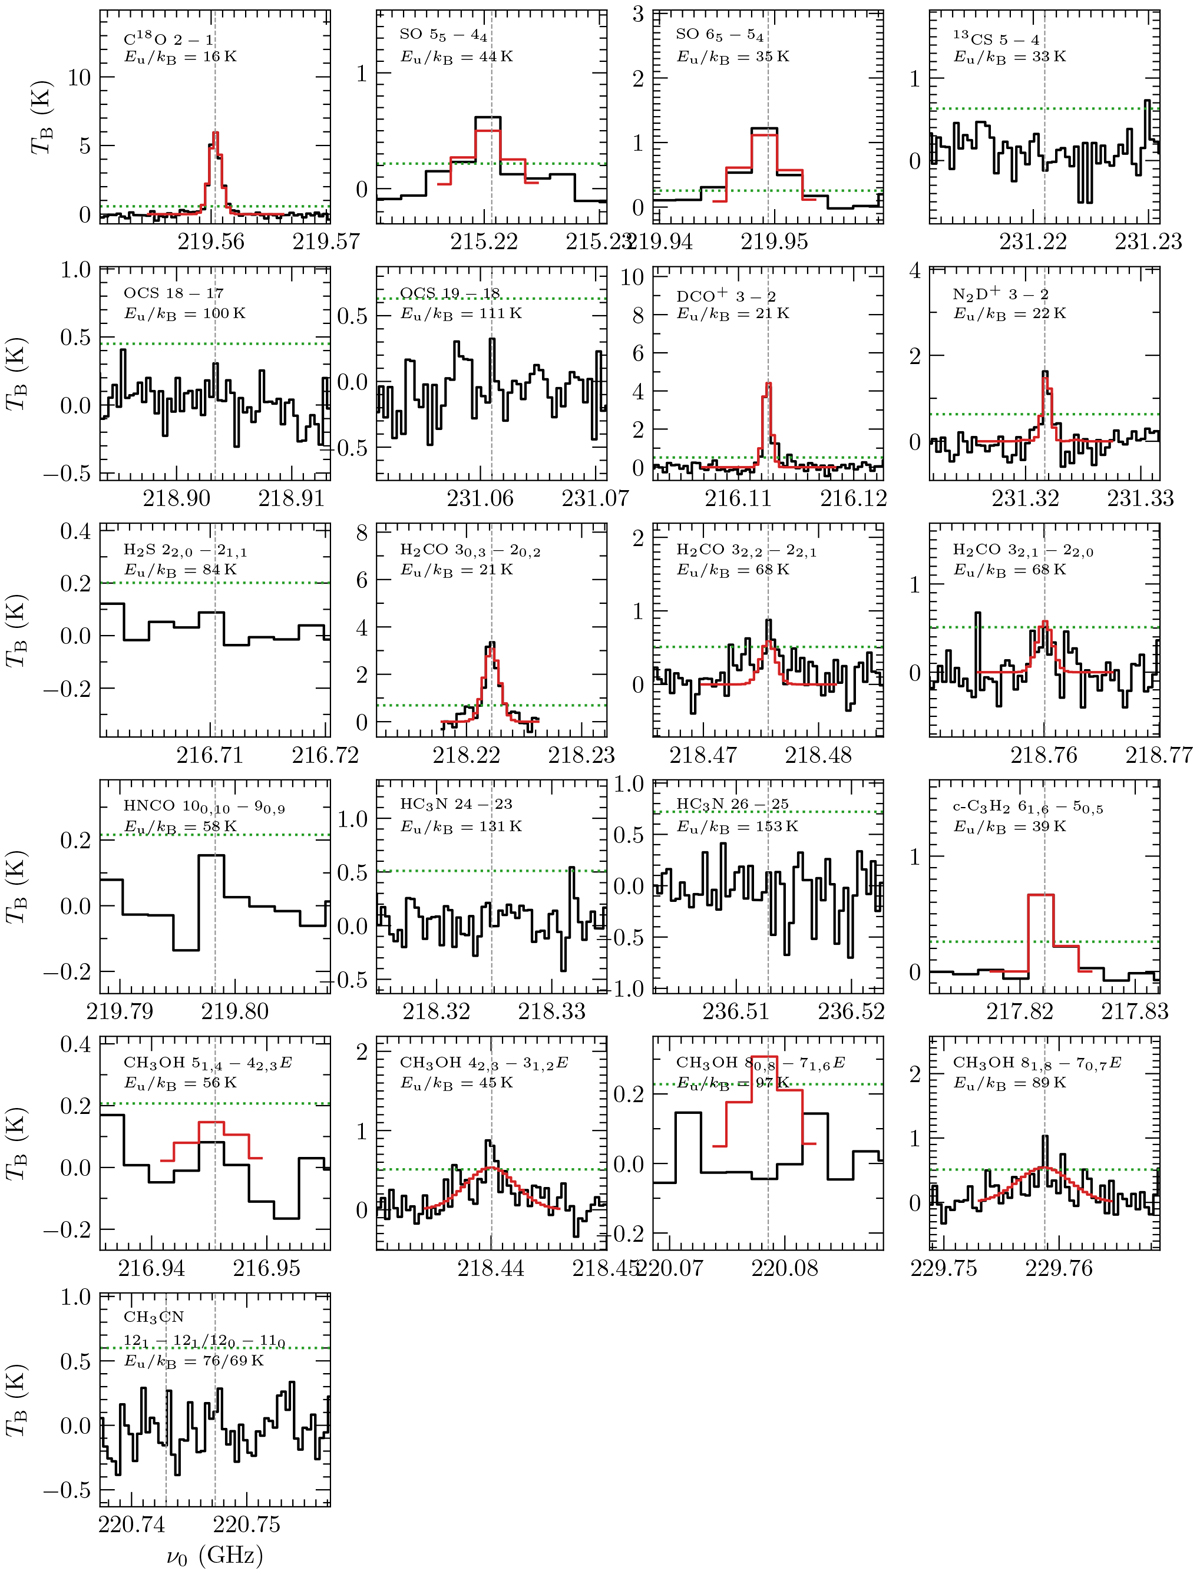
Fig. B.1
Download original image
Example spectrum of all molecular transitions fitted with XCLASS toward core 1 in ISOSS J22478+6357. In each panel, the observed spectrum of the emission line and the corresponding XCLASS fit are presented by the black and red lines, respectively. The green dotted line shows the 3σline level of the transition (Table 3). The gray dashed line indicates the rest frequency of the transition (Table 2). If XCLASS fits were discarded no fit is shown (the constraints are explained in Sect. 4.6). An example spectrum of core 1 in ISOSS J23053+5953 is shown in Fig. B.2.
Current usage metrics show cumulative count of Article Views (full-text article views including HTML views, PDF and ePub downloads, according to the available data) and Abstracts Views on Vision4Press platform.
Data correspond to usage on the plateform after 2015. The current usage metrics is available 48-96 hours after online publication and is updated daily on week days.
Initial download of the metrics may take a while.