Fig. A.24
Download original image
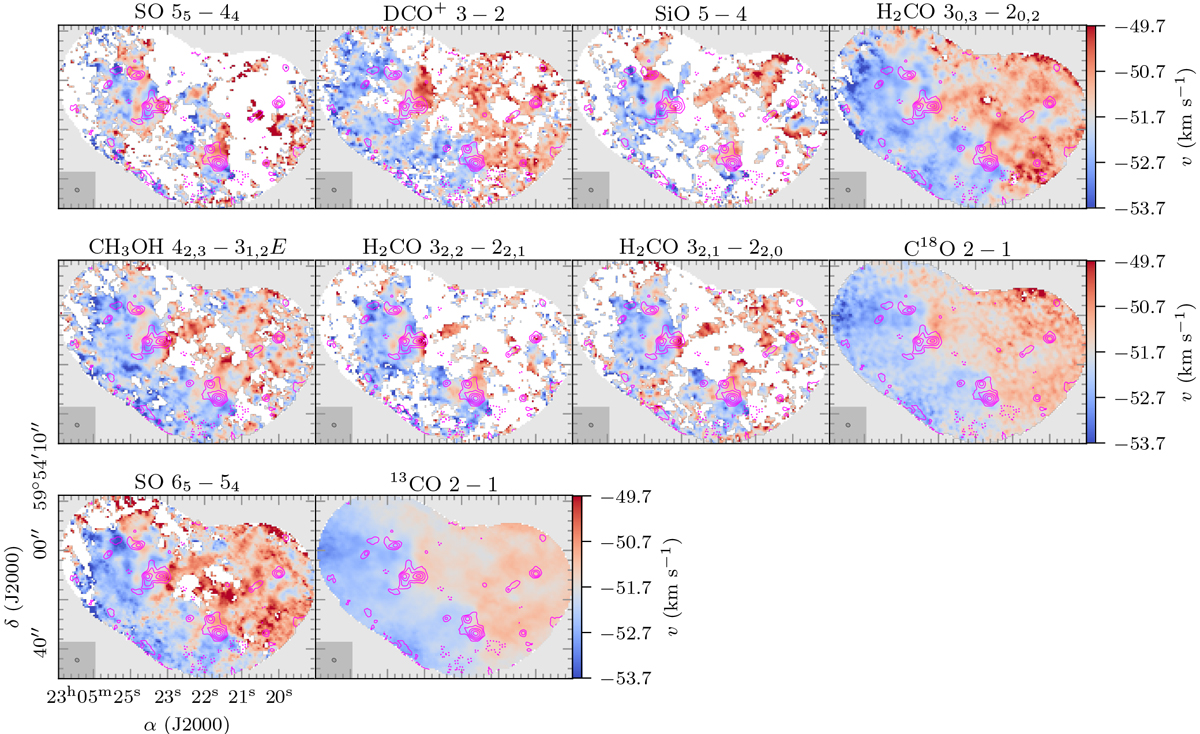
Intensity-weighted peak velocity (moment 1) maps of molecular lines with extended emission in ISOSS J23053+5953. The moment 1 map is presented in color scale (using a threshold of S∕N ≥ 3 of the line integrated intensity). The NOEMA 1.3 mm continuum data are shown in pink contours. The dotted pink contour marks the − 5σcont level. Solid pink contour levels are 5, 10, 20, 40, and 80σcont. The synthesized beam of the continuum data is shown in the bottom left corner. The synthesized beam of the spectral line data is similar.
Current usage metrics show cumulative count of Article Views (full-text article views including HTML views, PDF and ePub downloads, according to the available data) and Abstracts Views on Vision4Press platform.
Data correspond to usage on the plateform after 2015. The current usage metrics is available 48-96 hours after online publication and is updated daily on week days.
Initial download of the metrics may take a while.