Fig. 3
Download original image
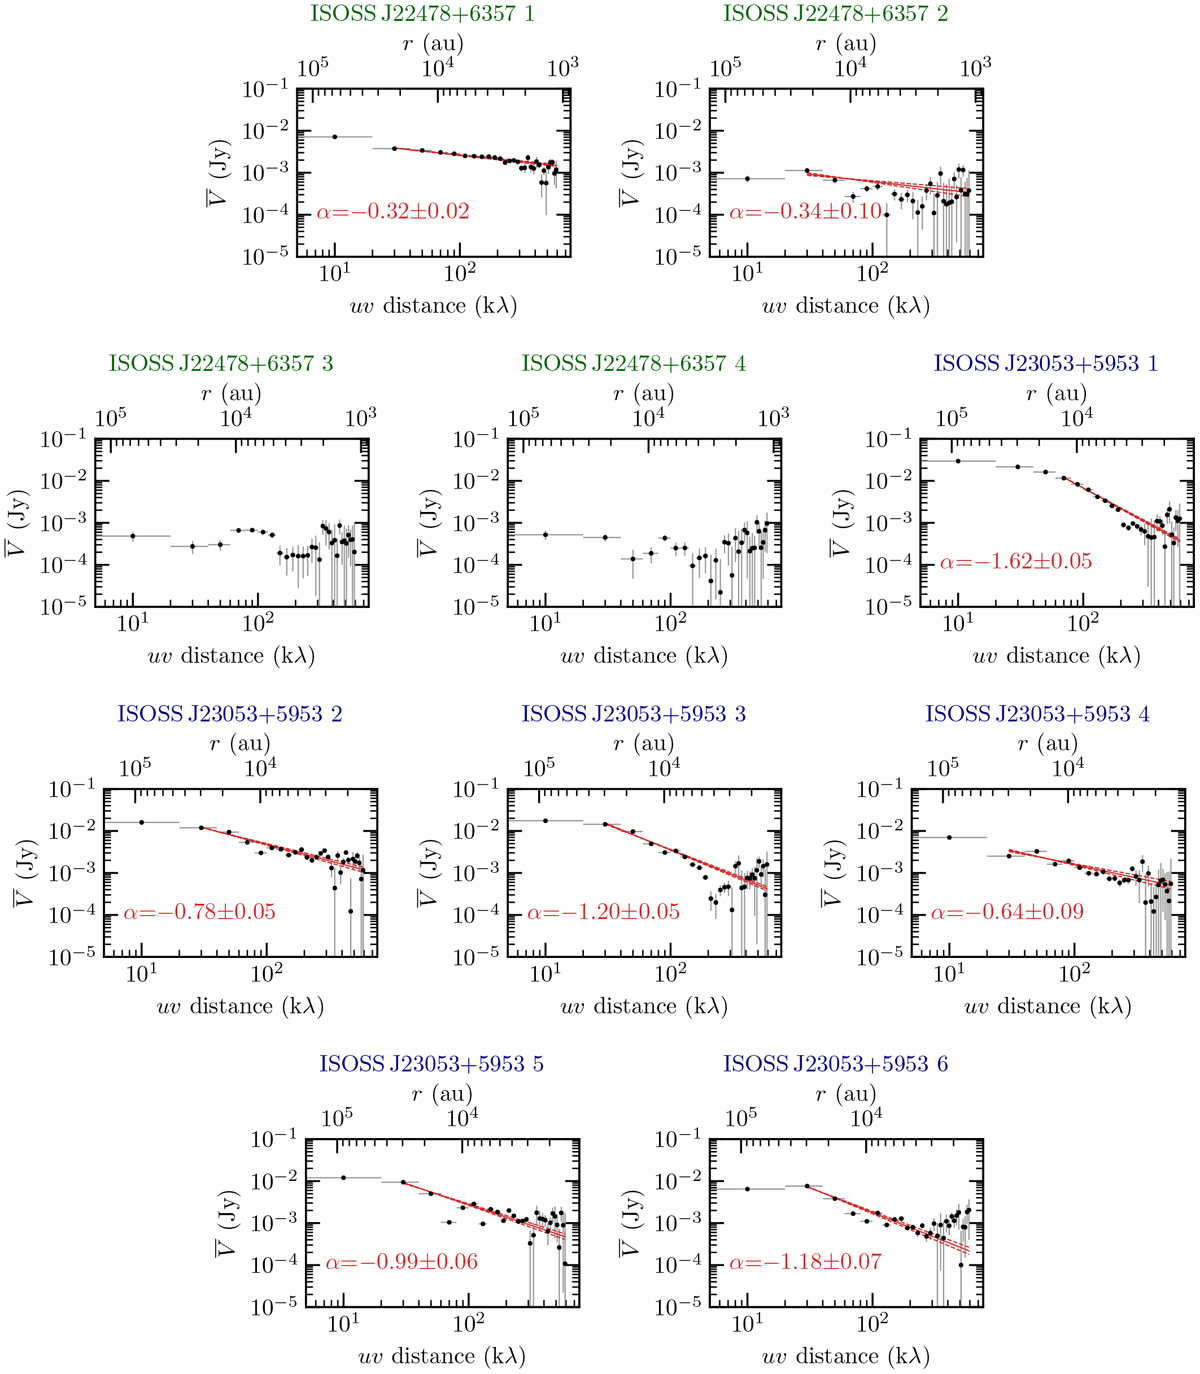
Radial visibility profiles of cores 1−4 in ISOSS J22478+6357 and cores 1−6 in ISOSS J23053+5953. The azimuthally averaged visibility amplitudes ![]() , considering the real and imaginary components, are shown in black. The bottom x-axis shows the uv distance and the top x-axis is converted to the corresponding linear spatial scale. A fit to the data and its uncertainties (±1σ) are shown by the red solid and dashed lines, respectively.
, considering the real and imaginary components, are shown in black. The bottom x-axis shows the uv distance and the top x-axis is converted to the corresponding linear spatial scale. A fit to the data and its uncertainties (±1σ) are shown by the red solid and dashed lines, respectively.
Current usage metrics show cumulative count of Article Views (full-text article views including HTML views, PDF and ePub downloads, according to the available data) and Abstracts Views on Vision4Press platform.
Data correspond to usage on the plateform after 2015. The current usage metrics is available 48-96 hours after online publication and is updated daily on week days.
Initial download of the metrics may take a while.