Fig. 2
Download original image
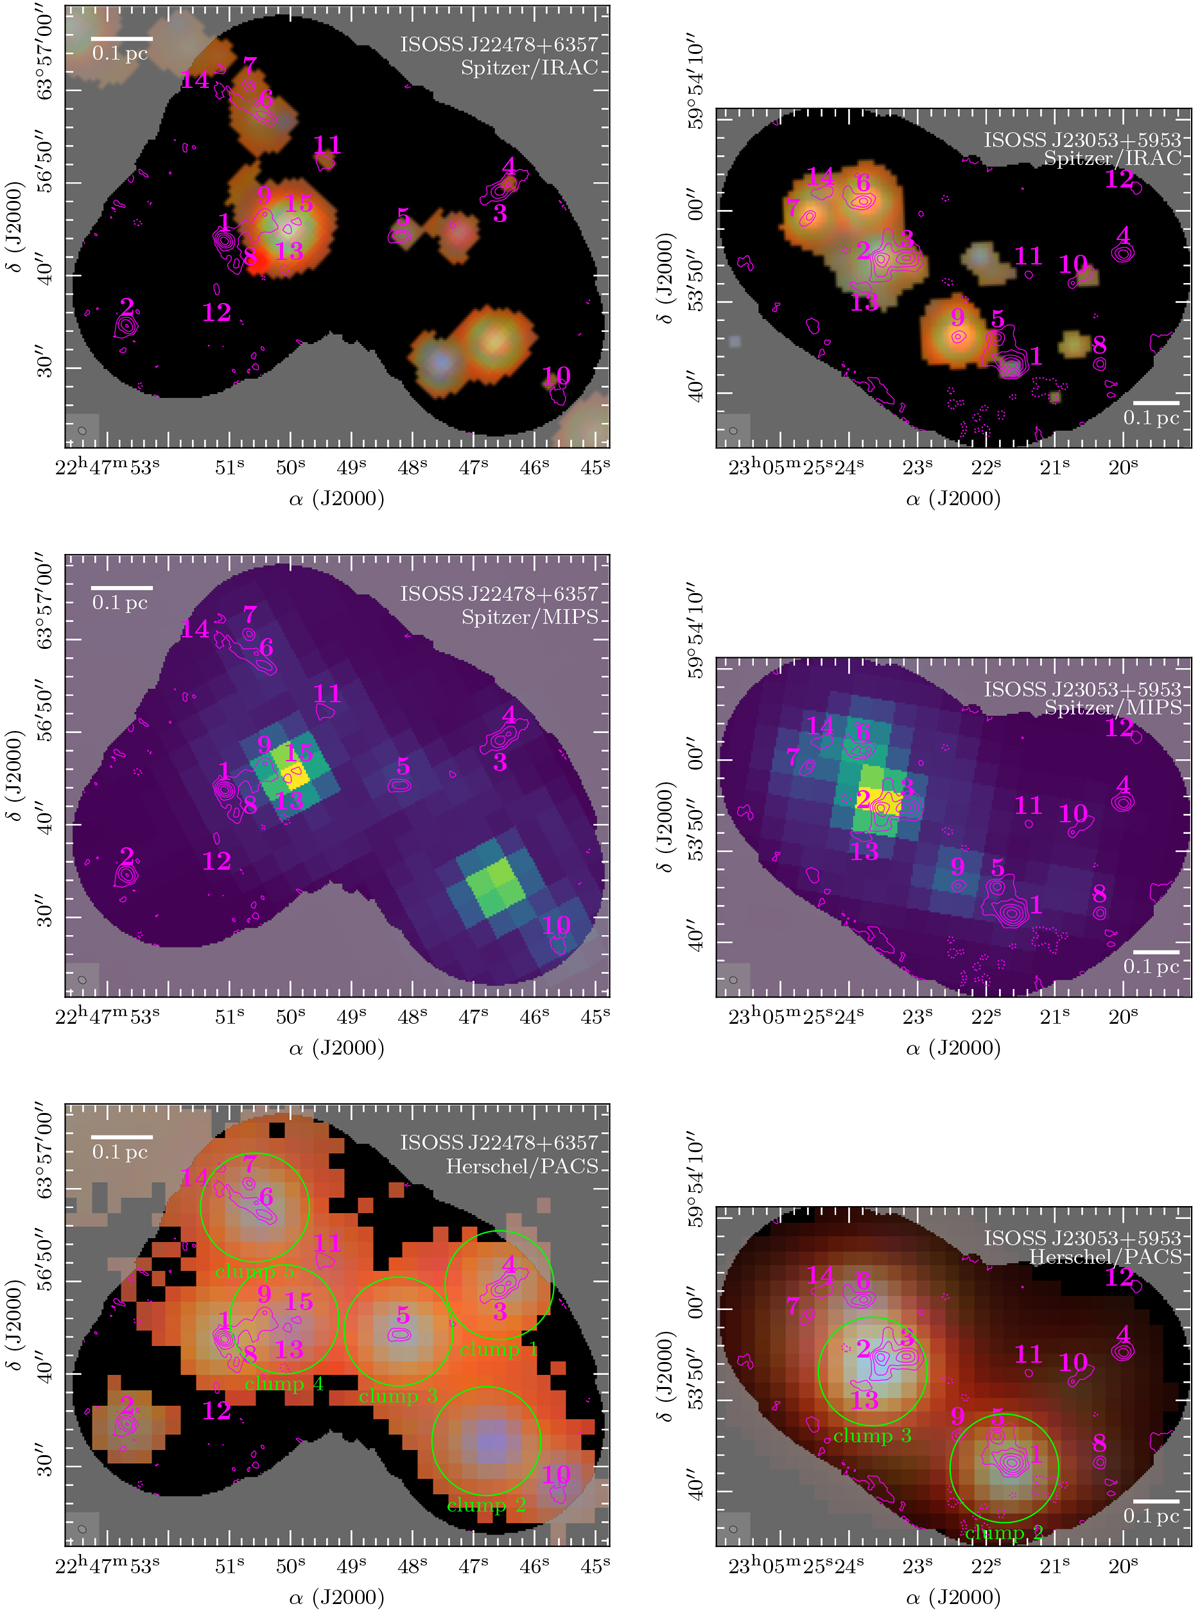
Multi-wavelength overview of ISOSS J22478+6357 (left panel) and ISOSS J23053+5953 (right panel). The top panels show a Spitzer IRAC composite RGB image at 4.5 (blue), 5.8 (green), and 8.0 μm (red). Emission with S∕N < 5 above the sky background is clipped and shown in black. The middle panels show Spitzer MIPS data at 24 μm. The bottompanels show a composite RGB image of Herschel PACS observations at 70 (blue), 100 (green), and 160 μm (red). Emission with S∕N < 5 above the sky background is clipped and shown in black. The Herschel clumps studied in Ragan et al. (2012) are indicated by green circles and labeled in green. In all panels, the NOEMA continuum data are shown in pink contours. The dotted pink contour marks the − 5σcont level. Solid pink contour levels are 5, 10, 20, 40, and 80σcont. The area outside of the NOEMA field-of-view is gray-shaded. All mm cores identified in Beuther et al. (2021) are labeled in pink. The synthesized beam of the NOEMA continuum data is shown in the bottom left corner. A linear spatial scaleof 0.1 pc is indicated by a white scale bar.
Current usage metrics show cumulative count of Article Views (full-text article views including HTML views, PDF and ePub downloads, according to the available data) and Abstracts Views on Vision4Press platform.
Data correspond to usage on the plateform after 2015. The current usage metrics is available 48-96 hours after online publication and is updated daily on week days.
Initial download of the metrics may take a while.