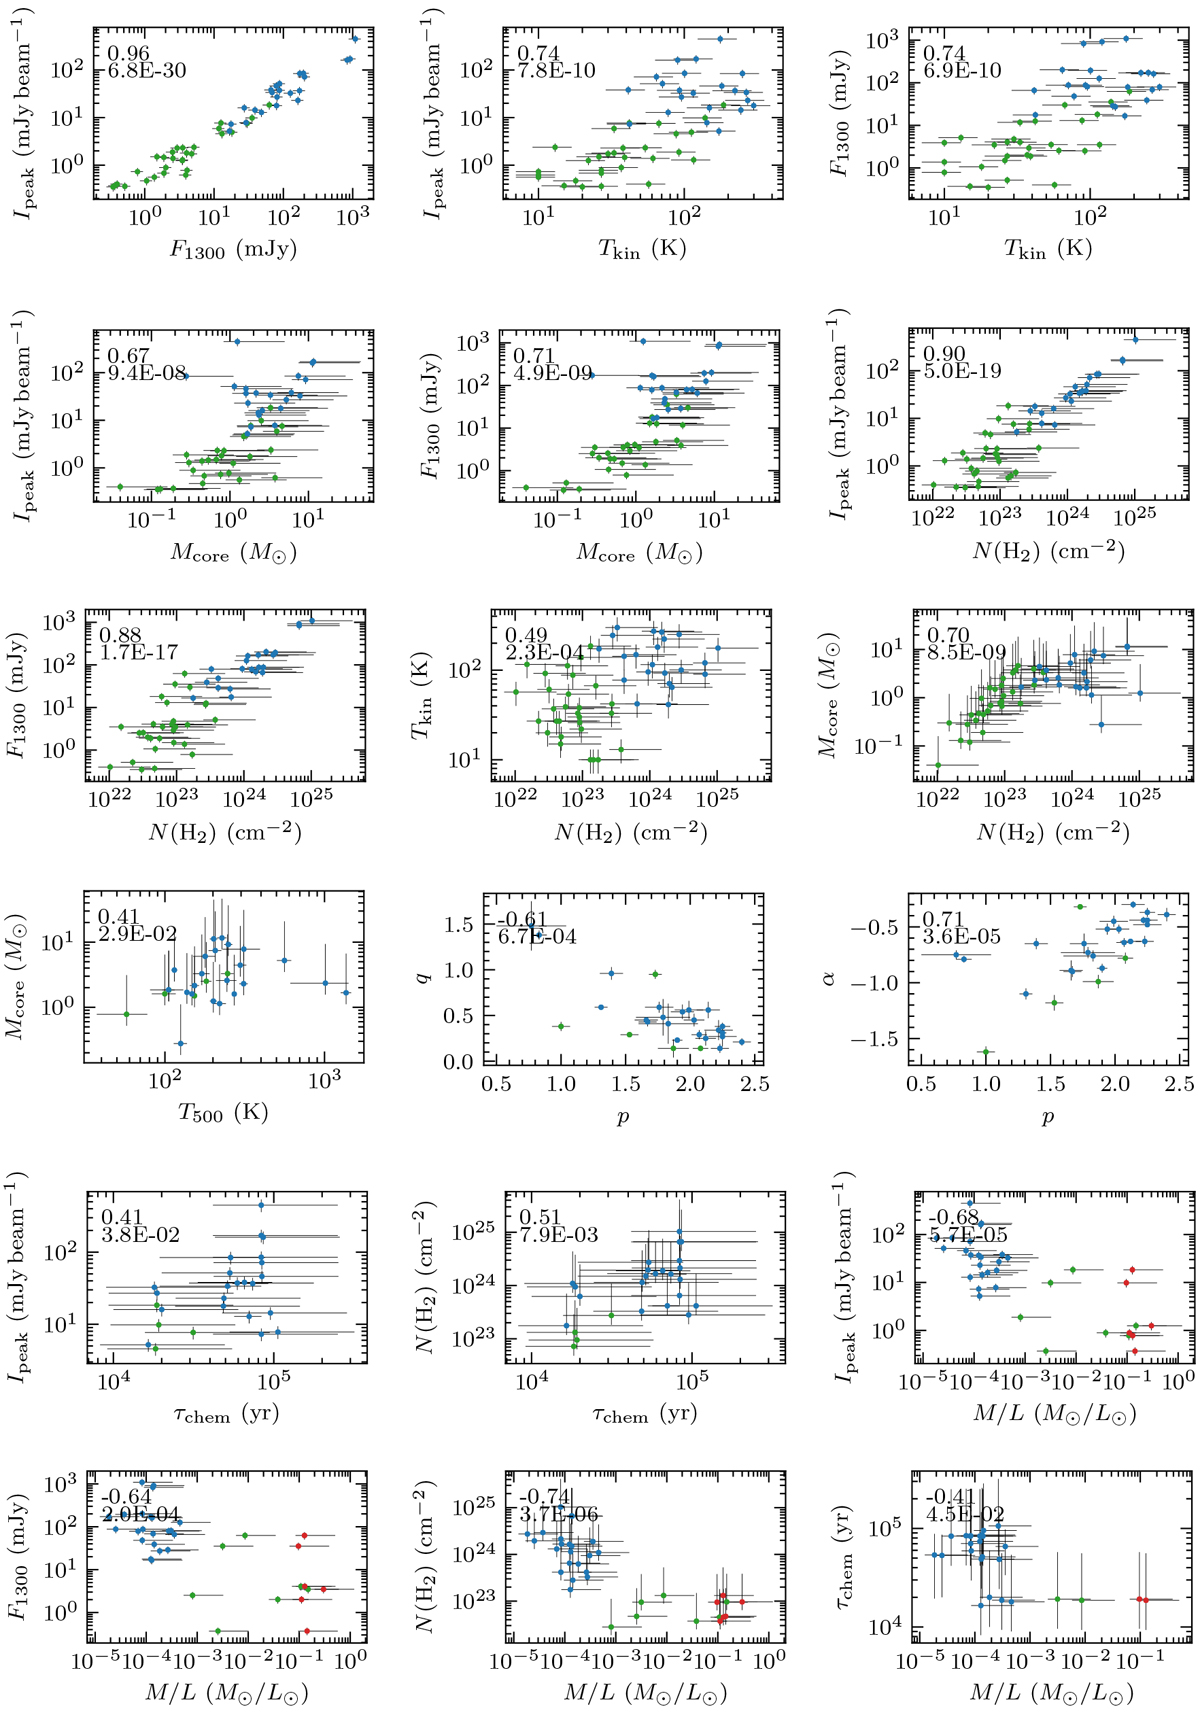
Fig. 17
Download original image
Core parameters with a Spearman correlation coefficient of |rS|≥ 0.4. The results for the cores in ISOSS J22478+6357 and ISOSS J23053+5953 are shown in green (this work, Tables 4–6) and the results for the cores of the original CORE sample are presented in blue (Gieser et al. 2021). In each panel, the correlation coefficient rS and p-value are shown in the top left corner. For completeness, the clump-average M/L ratio taken from Ragan et al. (2012) of the corresponding ISOSS cores (Table 4) is shown in red.
Current usage metrics show cumulative count of Article Views (full-text article views including HTML views, PDF and ePub downloads, according to the available data) and Abstracts Views on Vision4Press platform.
Data correspond to usage on the plateform after 2015. The current usage metrics is available 48-96 hours after online publication and is updated daily on week days.
Initial download of the metrics may take a while.