Open Access
Fig. 16
Download original image
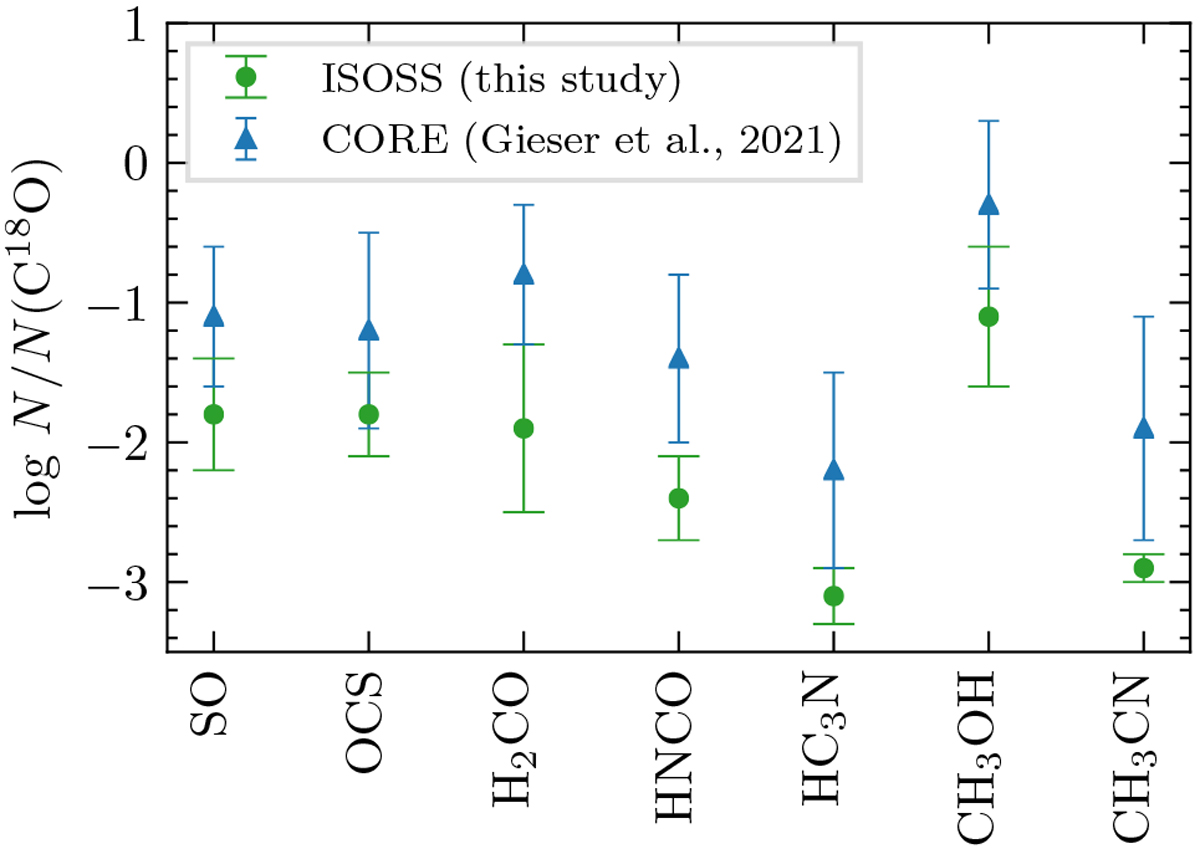
Mean abundances (relative to C18O) and standard deviation of the cores in both ISOSS regions (green circles) in comparison with the cores in the CORE sample (blue triangles) taken from Gieser et al. (2021). Only species that were studied both in this work and in Gieser et al. (2021) are shown.
Current usage metrics show cumulative count of Article Views (full-text article views including HTML views, PDF and ePub downloads, according to the available data) and Abstracts Views on Vision4Press platform.
Data correspond to usage on the plateform after 2015. The current usage metrics is available 48-96 hours after online publication and is updated daily on week days.
Initial download of the metrics may take a while.