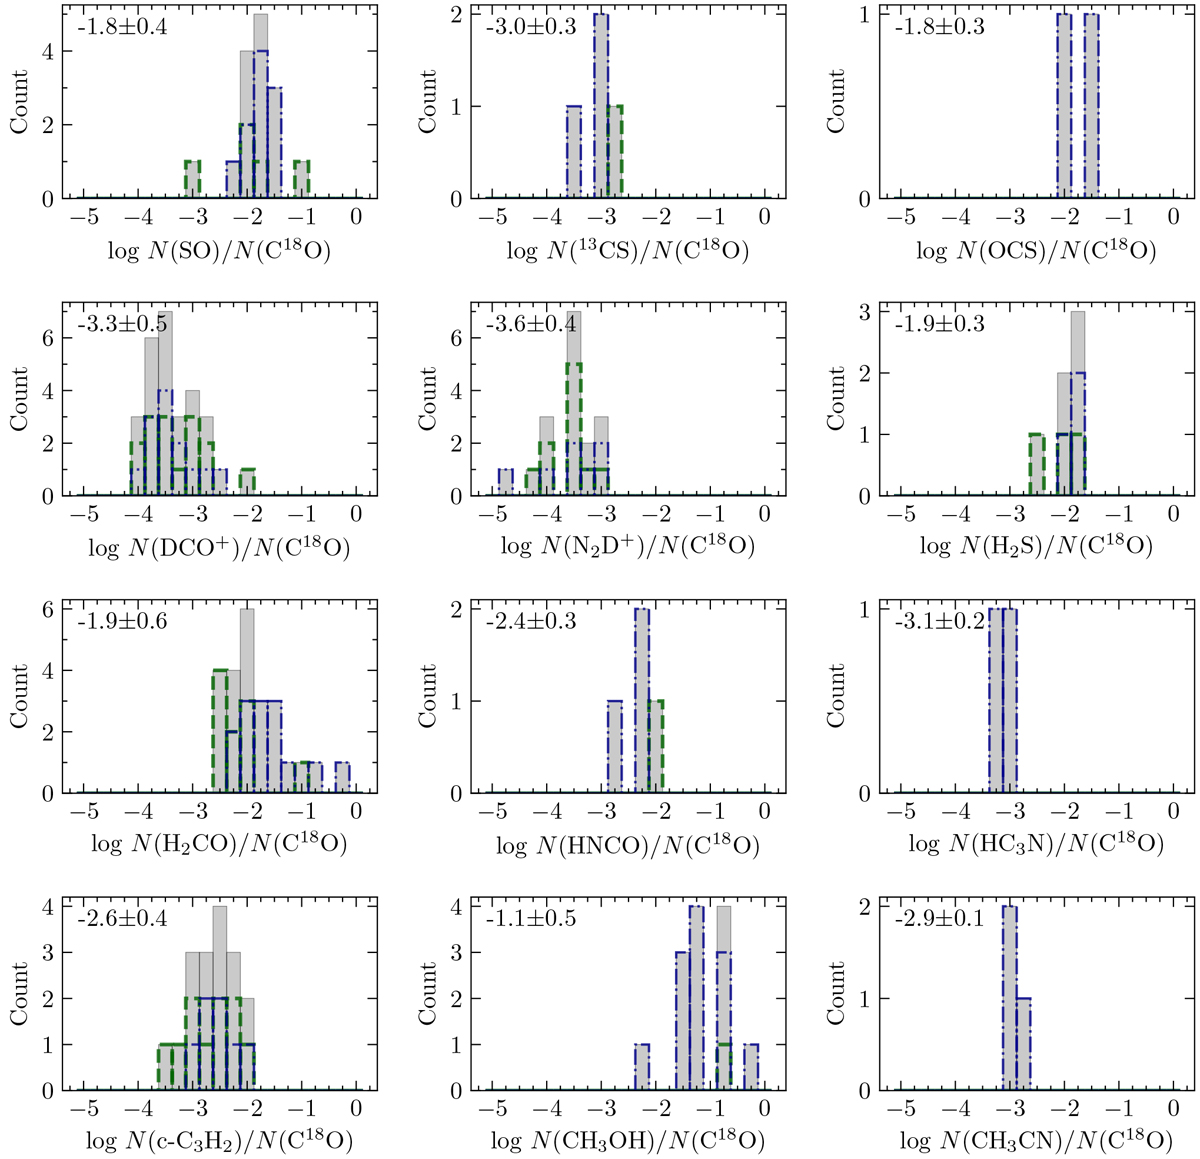
Fig. 14
Download original image
Abundance histograms (relative to C18O) of all species fitted with XCLASS. The gray histogram shows the combined results of all 29 cores. The mean and standard deviation are shown in the top left corner. The green dashed and blue dash-dotted histograms show the results for the cores in ISOSS J22478+6357 and ISOSS J23053+5953, respectively.
Current usage metrics show cumulative count of Article Views (full-text article views including HTML views, PDF and ePub downloads, according to the available data) and Abstracts Views on Vision4Press platform.
Data correspond to usage on the plateform after 2015. The current usage metrics is available 48-96 hours after online publication and is updated daily on week days.
Initial download of the metrics may take a while.