Fig. 13
Download original image
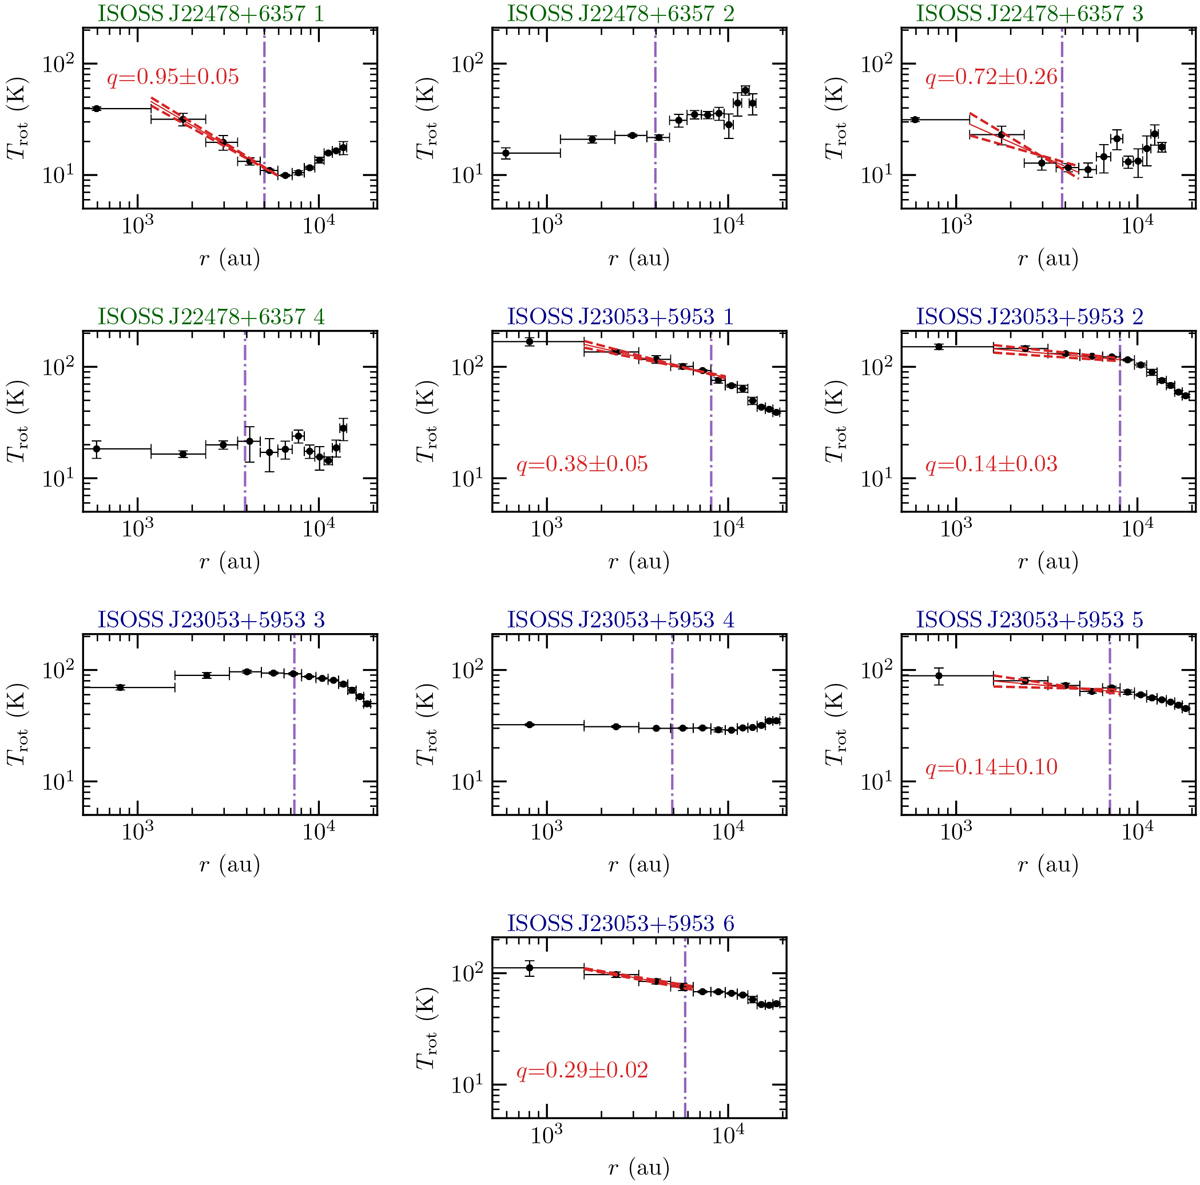
Radial temperature profile for cores 1−4 in ISOSS J22478+6357 and cores 1−6 in ISOSS J23053+5953. The radial H2CO temperature profile is shown by the black data points. The outer radius rout, estimatedwith the clumpfind algorithm in the continuum data (Table 4), is indicated by the dash-dotted purple vertical line. A fit to the data and its uncertainties (±1σ) are shown by the red solid and dashed lines, respectively.
Current usage metrics show cumulative count of Article Views (full-text article views including HTML views, PDF and ePub downloads, according to the available data) and Abstracts Views on Vision4Press platform.
Data correspond to usage on the plateform after 2015. The current usage metrics is available 48-96 hours after online publication and is updated daily on week days.
Initial download of the metrics may take a while.