Fig. 11
Download original image
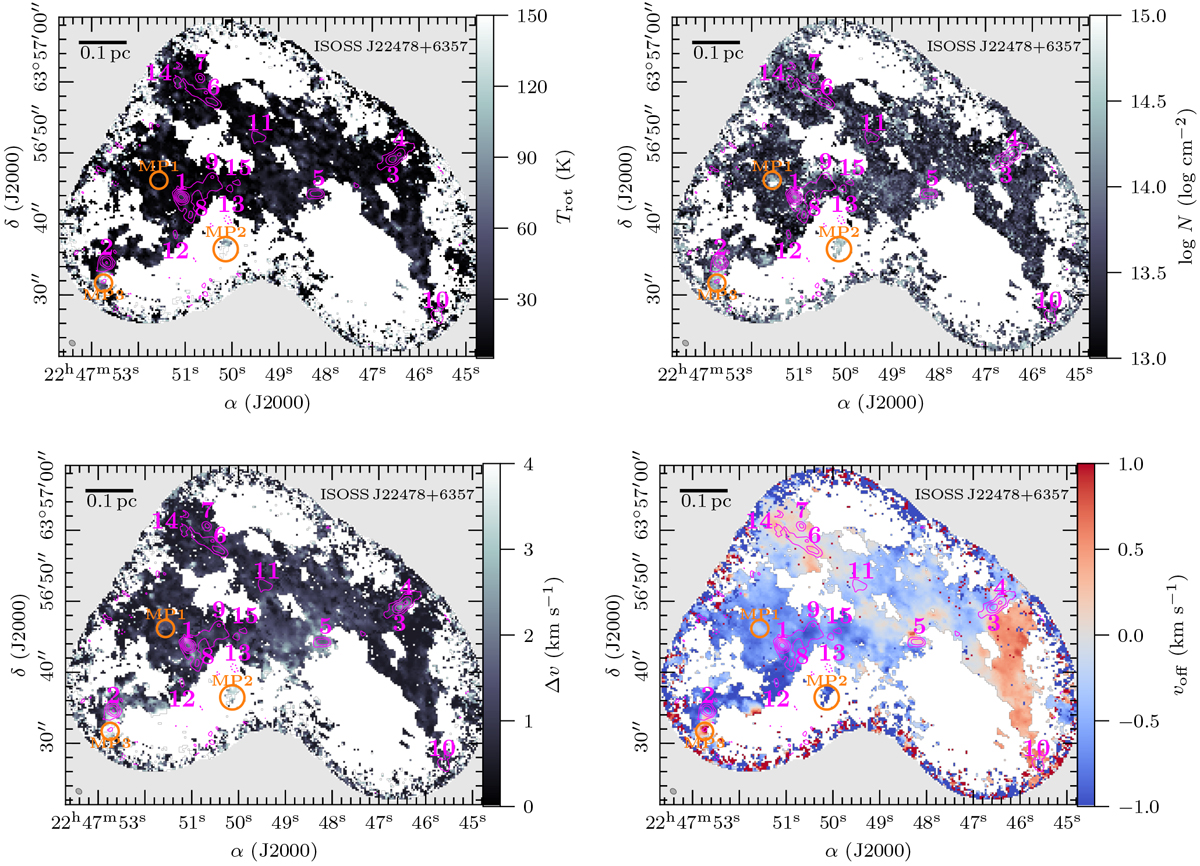
H2CO parameter maps of ISOSS J22478+6357 derived with XCLASS. The fit parameter maps (Trot, N, Δv, voff) for H2CO are presented in color scale. The NOEMA 1.3 mm continuum data are shown in pink contours. The dotted pink contour marks the − 5σcont level. Solid pink contour levels are 5, 10, 20, 40, and 80σcont. All mm cores identified in Beuther et al. (2021) are labeled in pink. Positions with a peak in molecular emission, but no associated continuum (“molecular peaks”, MP) are indicated by orange circles (Sect. 4.2.1). The synthesized beam of the continuum data is shown in the bottom left corner. The synthesized beam of the spectral line data is similar. A linear spatial scale of 0.1 pc is indicated by a black scale bar.
Current usage metrics show cumulative count of Article Views (full-text article views including HTML views, PDF and ePub downloads, according to the available data) and Abstracts Views on Vision4Press platform.
Data correspond to usage on the plateform after 2015. The current usage metrics is available 48-96 hours after online publication and is updated daily on week days.
Initial download of the metrics may take a while.