Fig. 10
Download original image
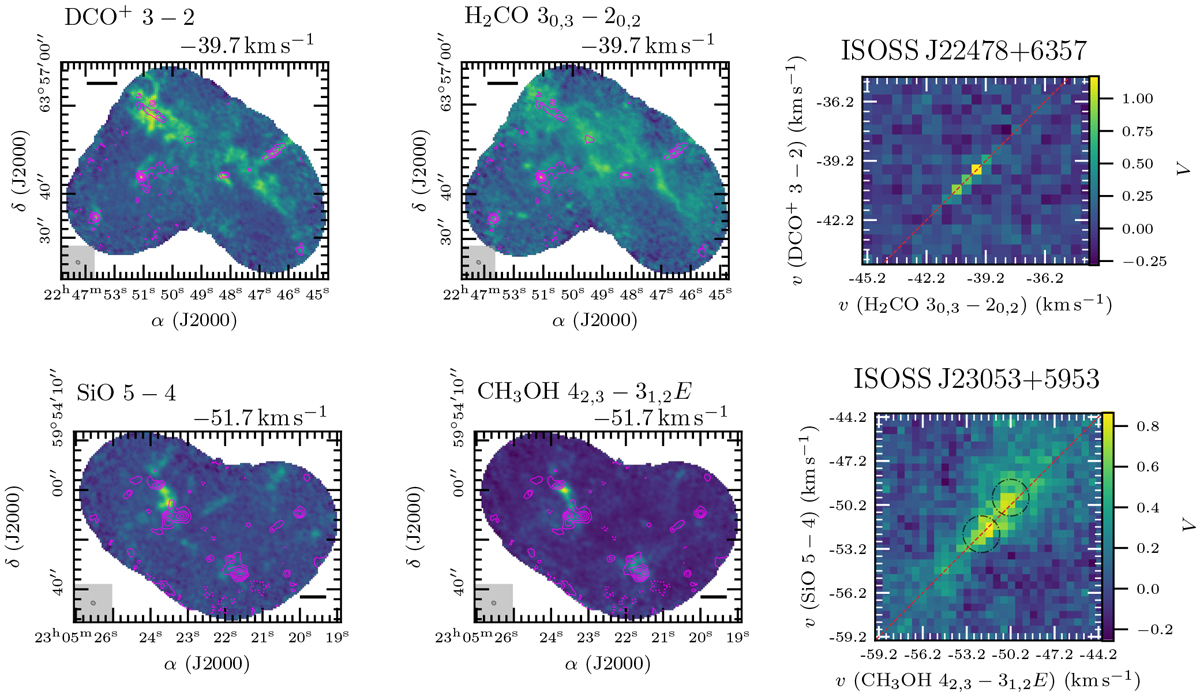
HOG correlation results for DCO+ (3− 2) and H2CO (30,3 − 20,2) toward ISOSS J22478+6357 (top panel) and for SiO (5−4) and CH3OH (42,3 − 31,2E) toward ISOSS J23053+5953 (bottom panel). Emission maps of the channels with the highest correlation are shown in the left and middle panels. The NOEMA 1.3 mm continuum data are shown in pink contours. The dotted pink contour marks the − 5σcont level. Solid pink contour levels are 5, 10, 20, 40, and 80σcont. The synthesized beam of the continuum data is shown in the bottom left corner. The synthesized beam of the spectral line data is similar. A linear spatial scale of 0.1 pc is indicated by a black scale bar. The projected Rayleigh statistic V, computed for all velocity pairs, is shown in the right panel. The red dashed line indicates equal velocity in both transitions. For ISOSS J23053+5953, the velocity regime around the two velocity components seen in line emission at v ≈ −52 km s−1 and − 50 km s−1 (Sect. 4.3) are highlighted by black dash-dotted circles.
Current usage metrics show cumulative count of Article Views (full-text article views including HTML views, PDF and ePub downloads, according to the available data) and Abstracts Views on Vision4Press platform.
Data correspond to usage on the plateform after 2015. The current usage metrics is available 48-96 hours after online publication and is updated daily on week days.
Initial download of the metrics may take a while.