| Issue |
A&A
Volume 657, January 2022
|
|
|---|---|---|
| Article Number | A63 | |
| Number of page(s) | 10 | |
| Section | Interstellar and circumstellar matter | |
| DOI | https://doi.org/10.1051/0004-6361/202141807 | |
| Published online | 11 January 2022 | |
Revisiting the formaldehyde masers
Centre for Space Research, North-West University,
Potchefstroom
2520,
South Africa
e-mail: johan.vanderwalt@nwu.ac.za
Received:
16
July
2021
Accepted:
30
November
2021
Context. The 4.8 GHz formaldehyde (H2CO) masers are one of a number of rare types of molecular masers in the Galaxy. There still is not agreement on the mechanism responsible for the inversion of the 110−111 transition and the conditions under which an inversion can occur, and therefore how to interpret the masers.
Aims. The aim of the present calculations is to explore a larger region of parameter space to improve on our previous calculations, thereby to better understand the range of physical conditions under which an inversion of the 110−111 transition occurs. We also aim to understand recently published results that H2CO masers are radiatively pumped.
Methods. We solve the rate equations of the first 40 rotational levels of o-H2CO using a fourth-order Runge-Kutta method. We consider gas kinetic temperatures between 10 and 300 K, H2 densities between 104 and 106 cm−3, and a number of different dust temperatures and grey-body spectral energy density distributions.
Results. We show that when using a black body radiation field the inversion of any transition will disappear as the kinetic temperature approaches the black-body radiation temperature since the system, consisting of the gas and radiation field, approaches thermodynamic equilibrium. Using a grey-body dust radiation field appropriate for Arp 220 we find that none of 110−111, 211−212, and 312−313 transitions are inverted for kinetic temperatures less than 100 K. Our calculations also show that in theory the 110−111 transition can be inverted over a large region of explored parameter space in the presence of an external far-infrared radiation field. Limiting the abundance of H2CO to less than 10−5, however, reduces the region where an inversion occurs to H2 densities ≳105 cm−3 and kinetic temperatures ≳100 K. We propose a pumping scheme for the H2CO masers which can explain why collisions play a central role in inverting the 110−111 transition, and therefore why an external radiation field alone does not lead to an inversion.
Conclusions. Collisions are an essential mechanism for the inversion of the 110−111 transition. Our results suggest that 4.8 GHz H2CO megamasers are associated with hot and dense gas typical of high mass star forming regions rather than with cold material. Although limiting the H2CO abundance to less than 10−5 significantly reduces the region in parameter space where the 110−111 is inverted, it still is not clear whether this is the only reason why these masers are so rare.
Key words: masers / stars: formation / ISM: molecules / radio lines: ISM
© ESO 2022
1 Introduction
The 4.8 GHz ortho-formaldehyde (hereafter H2CO) 110−111 masers belong to a small group of rare astrophysical masers. At present only eight Galactic high mass star forming regions with associated 4.8 GHz H2CO masers are known (Araya et al. 2008; Ginsburg et al. 2015), compared with the more than 900 6.7 GHz methanol masers associated with high mass star forming regions detected in the methanol multibeam survey (Green et al. 2017). Since the H2CO masers seem to be exclusively associated with high mass star forming regions (Araya et al. 2015), the question arises of what is special about these star forming regions with associated H2CO masers compared to the majority of high mass star forming regions without associated H2CO masers.
High luminosity 4.8 GHz megamaser emission has also been detected from the nuclear regions of three ultraluminous infrared (starburst) galaxies (Baan et al. 1986, 2017; Araya et al. 2004, 2008). Analogously to the question about the excitation of the 4.8 GHz masers in a few Galactic high mass star forming regions, the same question arises for the extragalactic H2CO megamasers. All three knownH2CO megamaser sources are also OH megamaser sources, which obviously raises the question of whether the two types of masers are excited in the same way.
Since the paper by Boland & de Jong (1981), the question of the pumping of H2CO masers has regularly been raised over a period of about four decades. Recently, a number of authors (see e.g. Ginsburg et al. 2015; Lu et al. 2019) have remarked that the issue of the pumping of the 4.8 GHz H2CO masers is still unclear, which makes it difficult to interpret their observations. Further uncertainty also followed from the statement by Baan et al. (2017) that the masers are radiatively pumped, while van der Walt (2014) showed that an inversion of the 110−111 transition can be achieved without the presence of an external far-infrared radiation field. van der Walt (2014) also found that no inversion could be found if collisions are switched off.
In view of the uncertainties in the pumping of the H2CO masers, we expanded the calculations of van der Walt (2014) to better cover the parameter space and thereby to obtain a more complete picture of the inversion of the 110−111 transition. We also present the results of calculations aimed at understanding the results obtained with RADEX by Baan et al. (2017) and whether inversion of the 110−111 transition can indeed be interpreted as being due to radiative pumping (by a black-body radiation field) as claimed by these authors. Following from the results, we propose a pumping scheme for the H2CO masers thatexplains why collisions play a central role in the inversion of the 110 − 111 transition. For the present purposes we do not consider the effect of beaming, but focus only on the physical conditions under which an inversion can occur.
2 Molecular data
Formaldehyde is a near prolate symmetric top molecule with the dipole moment along the C–O axis (the A-axis). The energy levels are characterized by three quantum numbers, J, Ka, and Kc, with J the total angular momentum, Ka the projection of J on the A-axis (the symmetry axis for a limiting prolate symmetric top), and Kc the projection of J on the C-axis (the symmetry axis for a limiting oblate symmetric top). In the case of o-H2CO, where the nuclear spins of the two hydrogen atoms are parallel, Ka is odd. The slight asymmetry of the molecule causes each rotational level to be split into two energy levels (known as K-doublets) characterized by different values of Kc.
The energy level diagram for the first 40 levels of o-H2CO used in this work is shown in Fig. 1 for Ka = 1, 3. The energy levels and Einstein A coefficients for allowed radiative transitions were taken from the Leiden Atomic and Molecular Database (Schöier et al. 2005). The coefficients for collisions of o-H2CO with o-H2 and p-H2, as calculated by Wiesenfeld & Faure (2013), were also obtained from the Leiden Atomic and Molecular Database. In all calculations the ratio of o-H2 to p-H2 was that for thermodynamic equilibrium at the specific kinetic temperature. For kinetic temperatures between 100 and 300 K, a linear interpolation was used to produce collision rate coefficients for 10 K intervals instead of the 20 K intervals listed in the Leiden Atomic and Molecular Database.
Formaldehyde has six vibrational normal modes with the lowest at an energy of 1167 cm−1 ≡ 1679 K (Nikitin et al. 2021). This is significantly higher than the excitation energies associated with high mass star forming regions and it is therefore not necessary to consider excitation to the vibrational states.
3 Numerical method
The level populations were found by solving the well-known set of rate equations, which in the escape probability approach is given by
![\begin{eqnarray*}\nonumber \frac{\textrm{d}N_i}{\textrm{d}t} & = & \sum_{j < i}\left[\left(-N_i + \left(\frac{g_i}{g_j}N_j - N_i\right)W\mathcal{N}_{ij}\right)\beta_{ij}A_{ij} \right. \\ \nonumber & & \left. + C_{ij}\left(N_j\frac{g_i}{g_j}e^{-E_{ij}/{kT}} - N_i\right)\right]\\ \nonumber & & + \sum_{j > i}\left[\left(N_j + \left(N_j - \frac{g_j}{g_i}N_i\right)W\mathcal{N}_{ji}\right)\beta_{ji}A_{ji} \right. \\ & & \left. + C_{ji}\left(N_j - N_i\frac{g_j}{g_i}e^{-E_{ji}/{kT}}\right)\right].\end{eqnarray*}](/articles/aa/full_html/2022/01/aa41807-21/aa41807-21-eq1.png) (1)
(1)
Here Ni is the number density in level i, gi the statistical weight of level i, Aij the Einstein A coefficient for spontaneous emission between levels i and j; W is the geometric dilution factor for an external radiation field with a spectral energy distribution (SED) given by
![\begin{equation*} F_{\nu}(T_{\textrm{d}}) = [1 - e^{-(\nu/\nu_0){}^p}]B_{\nu}(T_{\textrm{d}}),\end{equation*}](/articles/aa/full_html/2022/01/aa41807-21/aa41807-21-eq2.png) (2)
(2)
and  the photon occupation number for this field at frequency νij;
  is the collision rate with
  the H2 number density and Kij the collision rate coefficient. The fiducial frequency ν0 was taken as 3 × 10¹² Hz; βij is the escape probability for which we used the expression for the large velocity gradient approximation
 (3)
(3)
with the optical depth given by
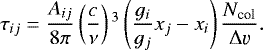 (4)
(4)
The quantities xi and xj are the fractional number densities of molecules in the upper level i and lower level j, respectively; Ncol is the H2CO column density and Δv the line width. The ratio Ncol∕Δv is the specific column density.
The rate equations were supplemented with the particle number conservation requirement
 (5)
(5)
with X the abundance of H2CO relative to H2.
We solve the rate equations using a fourth-order Runge-Kutta method. The initial distribution of the level populations was a Boltzmann distribution with temperature equal to the average of the dust and kinetic temperatures. For a given  the calculation started with a small H2CO specific column density (105 cm−3 s) such that the system is completely optically thin in all transitions. An equilibrium solution for this initial specific column density was then found by letting the system evolve in time steps of 5 seconds until the convergence condition |Ni (tj+1) − Ni(tj)|∕Ni(tj) < 10−6 is reached for all levels. The specific column density is then increased by a small amount (0.001 dex); the equilibrium solution for the previous value of the specific column density is used as the initial distribution. The process is repeated until a specific column density of 5 × 1013 cm−3 s is reached or is stopped if τ4.8 > 5 before this specific column density is reached. If there is an inversion in the range of specific column densities, the maximum negative optical depth and the corresponding specific column density are recorded. If there is no inversion τ4.8 = 0.
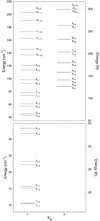 |
Fig. 1 Energy level diagram for the first 40 levels of ortho-formaldehyde. Lower panel: first eight levels with E < 50 K. Upper panel: levels with E > 50 K. The energy scales are different on the y-axes for the lower and upper panels to better separate thedoublet states at lower energies. |
4 Results
4.1 The Baan et al. (2017) case
We consider first Fig. 19 in Baan et al. (2017) which shows that inversion of the 110 − 111 and 211 − 212 transitions of H2CO can be achieved when locally the gas kinetic temperature is lower than the dust radiative temperature. Understanding the behaviour of the optical depth for different kinetic temperatures is essential before making any conclusions based on the shown behaviour.
Baan et al. (2017) obtained the results shown in their Fig. 19 using the online version of Radex (van der Tak et al. 2007). In particular, it should be noted that the online version of Radex uses an unshielded black-body radiation field (van Langevelde & van der Tak 2008) for the dust radiation. In Fig. 2 we show the dependence of the optical depth on the H2CO specific column density for the 110−111 transition for Tk = 10, 20, 30 K; Td = 50 K (undiluted black body); and  = 104 cm−3 obtained with the above-described numerical method to solve the rate equations. Although there are quantitative differences in the optical depths when compared with Fig. 19 of Baan et al. (2017), the behaviour for the different values of the kinetic temperature is the same, which means that the inversion is largest for Tk = 10 K and becomes smaller as the kinetic temperature increases to approach the dust temperature.
Figure 2 therefore confirms the result of Baan et al. (2017) that under the above-stated conditions the 110 − 111 transition shows an inversion. We note that since the radiation field used is that of an undiluted black body, increasing the kinetic temperature to approach the radiation temperature brings the system closer to thermodynamic equilibrium. Thus, when Tk = Td the level populations follow a Boltzmann distribution, in which case a population inversion is not possible. We illustrate this further in Fig. 3 where we compare the level populations for the lower energy levels where inversions occur, when Tk = 10, 20, 30, 50 K. The inversions for the different transitions are largest for Tk = 10 K and are seen to become smaller as Tk approaches 50 K. For Tk = Td = 50 K there is no inversion and, consistent with thermodynamic equilibrium, the level populations follow a Boltzmann distribution with a temperature of 50 K.
Still within the framework of the scenario proposed by Baan et al. (2017), we further examined the behaviour of τ4.8 in the  –Tk plane for 10 K ≤ Tk ≤ 300 K,
  , and when dust emission is that of an undiluted black body at 50 K. The result is shown in Fig. 4. It is seen that there are two distinct regions in the
  –Tk plane where the 110−111 transition is inverted. The first is asmall region with Tk < 40 K and which corresponds with the results shown in Fig. 2. The second is a much larger region with Tk ≳ 130 K and
  ≳ 104.8 cm−3. The absence of an inversion for kinetic temperatures around 50 K is simply a manifestation of the system being close to thermodynamic equilibrium. As we show below, the second region corresponds to the region where inversion is due to collisions only (i.e. without the presence of an external dust infrared radiation field).
In the present case inversion of the 110−111, 211 −212, and 312 −313 transitions has been achieved using a black-body radiation field for the dust emission. In reality the dust radiation field is not that of a black body. Staying within the scenario presented by Baan et al. (2017) that the dust temperature is ~50 K, we used the radio–to–far-infrared SED of Arp 220 derived by Yun & Carilli (2002). The SED of the dust emission is given by Eq. (2) with Td = 59 K and p = 1.15 (Yun & Carilli 2002) and is compared in Fig. 5 with that of a black body at thesame temperature. In Fig. 6 we show the corresponding variation of |τ4.8 | in the  –Tk plane. Comparison with Fig. 4 shows that while at higher densities and kinetic temperatures the shape of the region where there is an inversion of the 110 −111 transition is more or less the same, there is no inversion of the 110−111 transition for Tk ≲ 100 K in this case.
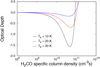 |
Fig. 2 4.8 GHz optical depth as a function of the H2CO specific column density for |

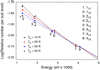 |
Fig. 3 Comparison of the level populations for levels |


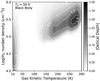 |
Fig. 4 Variation in the 4.8 GHz optical depth in the |

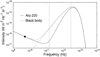 |
Fig. 5 Comparison of a black-body SED with the radio–to–far-infrared SED for Arp 220 (Yun & Carilli 2002). The left vertical dashed line is at 140.8 GHz, which is the frequency for the 313 − 111 transition. The right vertical dashed line is at 2808 GHz, which is the highest transition frequency for the 40 levels. |
4.2 Expanding the calculations of van der Walt (2014)
van der Walt (2014) presented results of the inversion of the 110−111 transition for a limited number of selected combinations of Tk,  , and Td which represented only small parts of the parameter space. We now turn to presenting somewhat more general results covering 10 K ≤ Tk ≤ 300 K and
  , where we consider the effect of having no external radiation field as a source of excitation and we investigate the effect of an external radiation field on the inversion of the 110−111 transition.
In Fig. 7 we show the behaviour of |τ4.8| in the  plane when the external radiation field is switched off (i.e. excitation is due only to the internal radiation field and collisions). Inversion of the 110−111 transition occurs for Tk ≳ 100 K and
  ≳ 104.5 cm−3. This result supports the results of van der Walt (2014) that the 110−111 transition can be inverted without the presence of an external far-infrared radiation field. It does not, however, explain what role collisions play in the pumping of the masers.
With regard to the choice of dust and gas kinetic temperatures, it is noted that Araya et al. (2015) concluded that Galactic H2CO masers are exclusive tracers of high mass star forming regions. Various studies of Galactic high mass star forming regions have found dust temperatures to be greater than ~50−60 K (see e.g. Kraemer et al. 2001; Barbosa et al. 2016; Lim & De Buizer 2019). This also applies to higher resolution observationsof Arp 220 by Wilson et al. (2014), among others, who derived average dust temperatures of 80 K and 197 K for the eastern and western nuclei, respectively. Downes & Eckart (2007) limits the intrinsic dust temperature in the western nucleus of Arp 220 to between 90 and 180 K based on the size and luminosity of the region. Scoville et al. (2015, 2017) derived a dust temperature >100 K for the western nucleus of Arp 220. We therefore considered three more cases with Td = 80, 100, and 150 K to illustrate the effects of higher dust temperatures and of geometric dilution. While presenting these results we acknowledge that the combinations of Td, Tk, and  presented do not necessarily take the thermal balance between dust and gas into account.
In Figs. 8–10 we therefore show the behaviour of |τ4.8 | in the  –Tk plane for Td = 80, 100, and 150 K, respectively. The lower panels in these figures are for the case of an undiluted radiation field (W = 1 in Eq. (2)). The upper panels in Figs. 8 and 9 are for geometric dilution factors W = 0.3, while the upper panel in Fig. 10 is for W = 0.1. The effect of higher dust temperatures is interesting in that the region in the
  –Tk plane over which the 110−111 transition is inverted changes significantly when W = 1. In Figs. 6 and 7 inversion occurs basically for Tk ≳ 100 K and
  ≳ 104.5 cm−3, whereas for warmer dust the inversion occurs at lower H2 densities and also somewhat lower kinetic temperatures. An undiluted warmer dust radiation field also results in larger values of |τ4.8| when compared to the case shown in Fig. 7. On the other hand, significant dilution (0.1–0.3) of the external radiation field in all three cases leads to a result very similar to that when collisions and the internal radiation field are the only mechanisms for excitation.
Closer inspection of Figs. 8 and 9 shows the presence of faint regularly spaced vertical regions of weak inversion of the 110−111 transition. For example, the top panel of Fig. 9 shows that for W = 0.3 the larger region of inversion connects to lower densities at Tk ~ 140 K and that regions of weak inversions also start to appear at Tk ~ 200 K and 260 K. This results in the wavy nature of the contours for  ≲ 104.5 cm−3 seen in both Figs. 8 and 9. Test runs with smaller time steps, smaller steps in specific column density, and different convergence criteria were performed to check if this behaviour is due to the numerical method used. In all these cases the wavy behaviour of the optical depth was present. The exact reason for this behaviour of the optical depth is not clear and has not been investigated further.
In addition to the dilution factor, we finally consider the effect of the shape of the SED of the dust emission. In Fig. 11 we show in the upper panel the variation of |τ4.8| for Td = 100 K when p = 0.5 in Eq. (2) and in the lower panel when p = 2.0. These two cases should be compared with the lower panel of Fig. 9 for which p = 1.15. It can be seen that although the region over which the 110−111 transition is inverted is more or less the same for the three values of p, |τ4.8 | is smaller over the whole region for p = 0.5 and larger when p = 2.0. In the Rayleigh-Jeans limit and for in Eq. (2), Fν(Td) ∝ ν2+p. When p = 0, Fν (Td) = 0.63Bν(Td) ∝ ν2, which is the flattest possible SED in the Rayleigh-Jeans regime. Except for the factor of 0.63, the result presented in Fig. 4 corresponds to the case when p = 0. Therefore, considering Figs. 4, 9, and 11, there is a clear dependence of |τ4.8| on the behaviour of the SED at frequencies lower than the turnover frequency: flatter power laws (smaller p) result in smaller values of |τ4.8| compared to steeper power laws (larger p).
As a last result we note that by following exactly the same calculational procedure as when collisions are included, no evidence could be found for the 110−111 transition being inverted by the external dust radiation field (i.e. when collisions are switched off).
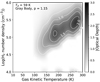 |
Fig. 6 Variation of |τ4.8| in the |

![$F_{\nu}(T_{\textrm{d}}) = [1 - e^{-(\nu/\nu_0){}^p}]B_{\nu}(T_{\textrm{d}}) $](/articles/aa/full_html/2022/01/aa41807-21/aa41807-21-eq45.png)
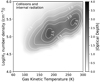 |
Fig. 7 Variation of |τ4.8| in the |

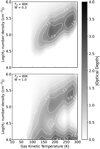 |
Fig. 8 Variation of |τ4.8| in the |

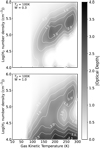 |
Fig. 9 Variation of |τ4.8| in the |

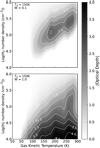 |
Fig. 10 Variation of |τ4.8| in the |

5 Discussion
Inspection of Figs. 7–11 shows some interesting behaviour of the 110 −111 maser which had not been seen or anticipated in the results of van der Walt (2014). Although the basic conclusions of van der Walt (2014) are, in a limited sense, still valid, this study shows that the presence of a far-infrared dust radiation field significantly affects the region in the  –Tk plane where an inversion can occur. This obviously calls into question the conclusion by van der Walt (2014) that the 4.8 GHz H2CO masers are strictly collisionally pumped. If a far-infrared radiation field has such a significant effect on the 4.8 GHz masers, then what is the role of collisions, especially if no inversion seems to occur when collisions are switched off? There are two theoretical limiting results which indicate that collisions play a central role in the inversion of the 110 −111 maser. The first is that an inversion can be obtained without the presence of an external far-infrared radiation field, and the second that no inversion is found if collisions are switched off even if an external far-infrared radiation field is present. These two limiting cases, as well as the other results, must be the consequence of a specific pumping scheme for the formaldehyde masers. We propose a possible pumping scheme and attempt to explain the results within this framework.
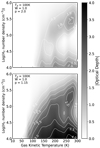 |
Fig. 11 Comparison of the variation of |τ4.8| in the |

![$F_{\nu}(T_{\textrm{d}}) = [1 - e^{-(\nu/\nu_0){}^p}]B_{\nu}(T_{\textrm{d}}) $](/articles/aa/full_html/2022/01/aa41807-21/aa41807-21-eq51.png)
5.1 Proposed pumping scheme
To create a population inversion for the 110−111 transition, it is necessary that the excitation rate out of the 111 state be faster than the rate at which the 110 state is populated through downward transitions from higher energy states. Inspection of the Einstein A coefficients shows that the fastest radiative downward route to 110 is through the upper levels of the doublet states of Ka = 1 (e.g. 716 → 615 → 514 → 413 → 312 → 211 → 110). It therefore seems that the pumping scheme must be such that there is a route and mechanism whereby molecules can be excited to the upper levels of the doublet states. Direct upward radiative excitation out of 111 to the upper levels of the doublet states is limited to ΔJ = 0, 1, ΔKc = ±1 and must therefore start with excitation first to 110. However, this transition is very slow. For example, for an undiluted dust radiation field as in Eq. (2) with Td = 100 K and p = 1.15 (the case for Arp 220; the exact value is not important for this example), the radiative transition rate for 111 → 110 is only 7.4 × 10⁻¹⁰ s−1. On the other hand, the corresponding rate for 111 → 212 is 2.9 × 10⁻⁵ s−1. Upward radiative excitation out of 111 via 212 to the lower levels of higher J doublet states (e.g. 313, 414, 515) is therefore much faster than via 110 to the upper levels of higher J doublet states (e.g. 211, 312, 413, 514).
To populate the 110 state, and since radiative excitation out of 111 via 110 to the upper levels of the doublet states is very slow, it is necessary to transfer molecules from the lower levels of the doublet states to the upper levels of the doublet states, which then provides a fast radiative decay route to 110. However, radiative transitions from the lower levels of the doublet states to the associated upper levels are very slow compared to radiative transitions between the lower levels of the doublet states. For example, the radiative transition rate for 515 → 514 is 6.2 × 10⁻⁸ s−1 for Td = 100 K and p = 1.15. On the other hand, the radiative transition rate for 515 → 414 is 1.2 × 10⁻³ s−1 and 4.2 × 10⁻⁴ s−1 for 515 → 616. The implication is that if a molecule is excited from 111 to 212 (the lower doublet state for J = 2), further upward and downward radiative excitations will only be within the ladder of lower level doublet states.
We illustrate the above in Fig. 12, where radiative and collisional rates for different transitions are compared for the case when  = 104.25 cm−3, Tk = 180 K, Td = 100 K, and p = 1.15. In the upper panel we show the radiative rates for upward transitions (ΔJ = +1, ΔKc = +1, black squares) between the lower levels of the doublet states, the corresponding downward rates (ΔJ = −1, ΔKc = −1, filled red dots), and the upward radiative rates from the lower levels of the doublet states to the corresponding upper levels (ΔJ = 0, ΔKc = −1, e.g. 515 → 514, open circles) for Ka = 1. Radiative rates between the Ka = 1 and Ka = 3 ladders are so low that radiative transitions between the ladders can be ignored. Also shown are the total collision rates out of the lower level of the doublet states to any other level (blue triangles), and more specifically the collision rates from the lower levels of the doublets to any of the upper level doublet states (red diamonds). As can be seen, the upward radiative rates between the lower levels of the doublet states (black squares) are orders of magnitude higher than the radiative rates from the lower levels of the doublet states to their associated upper levels of the doublet states (open circles). This illustrates the point made above that if a molecule is excited (radiative or collisionally) from 111 to the 212 state, further radiative transitions will only be within the ladder of the lower levels of the doublet states and that radiative transfer of molecules from the lower levels of the doublet states to their associated upper levels is not effective. On the other hand, under the given physical conditions, collision rates from the lower levels of the doublet states to any of the upper levels of doublet states (red diamonds) are significantly higher than the corresponding radiative rates. This is also the case, at least for the seven lowest levels of the doublet states above 111, specifically for collisional transfer of molecules from the lower levels of the doublet states to any of the upper levels of the doublet states (red diamonds). It can therefore be concluded that collisions are the mechanism responsible for population transfer from the lower to the upper levels of the doublet states.
The bottom panel of Fig. 12 shows the corresponding case for the upper levels of the doublet states. Also in this case it is seen that the radiative rates for transitions from the upper levels of the doublet states to the associated lower levels is small compared to radiative rates between the different upper levels of the doublet states and the collisional rates from the upper to the lower levels of the doublet states. Both the upper and lower panels show rather clearly that population exchange between the lower and upper levels of the doublet states is preferentially through collisions and not radiation.
Excitation out of 111 need not be mainly radiative, but for a given Tk and  it also depends on the energy density in the radiation field at the respective frequencies for the 111 → 110 (4.8 GHz) and 111 → 212 (~140 GHz) transitions. In Fig. 13 we show the case when p = 2, in other words when the SED for ν ≪ ν0 (Eq. (2)) is significantly steeper (Iν ∝ ν4) than for p = 1.15 (Iν ∝ ν3.15). It is seen that the upward radiative rates for the lower levels of the doublet states (upper panel, black squares) are significantly lower and for the lower J levels even lower than the collisional rates. Collisional excitation out of 111 actually dominates radiative excitation in this case. The radiative rates for the transfer of molecules from the lower levels of the doublet states to any of the upper levels of the doublet states (open circles) are now also significantly smaller compared to the corresponding collision rates (red diamonds). Thus, as for p = 1.15, population exchange between the lower and upper levels of the doublet states through collisions is by far the dominant process for p = 2.
A possible pumping scheme is therefore that molecules are radiatively or collisionally excited out of the 111 state. Radiative excitation out of 111 is almost exclusively to the 212 state from where further upward radiative excitations to the lower levels of the doublets can take place. Collisional excitation out of 111 can be either to the lower or upper levels of the doublets. Radiative excitation out of 111 to 110 is very slow, which means that the ladder of lower level doublet states will be populated significantly faster than the ladder of upper level doublet states. A fraction of the population in the lower level doublet states is collisionally transferred to the upper level doublet states, which then provides a relatively fast downward radiative route to 110 to create a population inversion. Figure 14 is a schematic representation of the proposed pumping scheme.
The above-proposed pumping scheme can account, at least qualitatively, for the presented results. First, it is clear that without collisions (i.e. with only the internal and external radiation fields present) there can be no effective population transfer from the ladder of lower doublet states to the upper doublet states to eventually overpopulate the 110 state relative to the 111 state. This explains the absence of an inversion when collisions are switched off. Comparison of the bottom panel of Fig. 9 and both panels of Fig. 11 shows that the inversion of the 110 −111 transition is smaller for p = 0.5 compared to the cases of p = 1.15 and p = 2. Since the energy density in the radiation field varies as ν2+p for ν ≪ ν0, it follows that for p = 0.5 the radiative excitation rates out of the lower levels of the doublets is significantly higher than for p = 2. The upper panel of Fig.12 also shows that the upward and downward radiative rates for the lower levels of the doublet states are very similar for p = 1.15. As a consequence, molecules are more or less ‘trapped’ within the ladder of lower doublet states when p = 0.5 with the probability to be collisionally transferred to the ladder of upper levels of the doublet states being small. On the other hand, for p = 2 the downward rates within the ladder of lower level doublet states are markedly higher than the upward rates, meaning that molecules in higher J states will rather quickly radiatively decay to lower states where the probability for collisional transfer to the ladder of upper level doublet states is comparable to that of upward radiative excitation within the ladder of the lower levels of the doublet states. Such a scenario can explain why the inversion is larger for p = 2 than for p = 0.5.
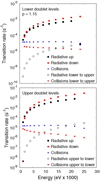 |
Fig. 12 Radiative and collision rates of the different energy levels for the lower levels of the doublet states (upper panel) and upper levels of the doublet states (bottom panel). The rates were calculated for Td = 100 K, Tk = 180 K, |

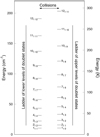 |
Fig. 14 Energy level diagram of lower levels of the doublets and the upper levels of the doublets to illustrate the proposed pumping scheme for the 4.8 GHz H2CO masers. Collisions couple the two sets of states. |
5.2 Constraints due to the H2CO abundance
Figures 8 to 11 suggest that inversion of the 110 −111 transition can happen over a significant part of the parameter space with the implication that the 4.8 GHz masers should be quite abundant. However, the H2CO masers are very rare, which means that there must be other factors that affect the occurrence of these masers. van der Walt (2014) noted that his results imply that the H2CO abundance must be significantly higher than what is generally observed. In our calculations the H2CO abundance,  , is implicitly included in the specific column density given by
  , where ℓ is the maser path length and Δv the maser line width. In the variation of τ4.8 with the specific column density (e.g. as in Fig. 2) the most obvious specific column density that can be used to calculate the abundance is that where the optical depth has its maximum negative value. Figure 15 shows, as an example, the variation of the optical depth and
  at Tk = 180 K for Td = 80, 100, 150 K, W = 1 (Figs. 8– 11), Δv = 105 cm s−1, and ℓ = 1017 cm (Cragg et al. 2002). The variation of the optical depth with
  for the three dust temperatures is seen to be quite different. On the other hand, the derived H2CO abundances behave in the same way and vary between ~1.0 × 10⁻⁴ and ~1.3 × 10⁻⁷ from
  = 104 cm−3 to 106 cm−3. Using the filling factor corrected data presented in Table 8 of Ginsburg et al. (2011), an average
  of 4.5 × 104 cm−3 and average H2CO abundance of 1.1 × 10⁻¹¹ for more than 60 lines of sight were found. It is clear that the observed abundances are orders of magnitude too small toexplain the masers. The required abundances are significantly higher than most models can produce (see e.g. Guzmán et al. 2011). It is worth noting, however, that Maret et al. (2004) derived a H2CO abundance of 6 × 10⁻⁶ for the warm inner envelope of the young low mass star L1527. This suggests that similar cases may also exist for young high mass stars.
Recently Vichietti et al. (2016) proposed a chemical route for the production of H2CO in young high mass star forming regions leading to abundances as high as 10−5. Using this as a guide, we illustrate in Fig. 16 what the effect is of setting an upper limit of 10−5 for the H2CO abundance on the region in the  –Tk plane wherean inversion can occur. Comparison with Fig. 9 shows that the allowed region for an inversion is significantly smaller than when no constraint is put on the H2CO abundance. Such a significantly smaller region in the
  –Tk plane might be a reason for the rarity of the H2CO masers.
An important aspect of Fig. 16 is that for W = 0.3 (upper panel) inversion of the 110 −111 transition occurs basically for  . Within the framework of our calculations the implication is that the collision rates as shown in Figs. 12 and 13 (blue triangles and red diamonds) have to be increased by a factor of 1.25 dex. If this is done the collisional excitation rate out of 111 is seen to dominate the radiative excitation rate by more than an order of magnitude. If this is the case it can indeed be said that the H2CO masers are collisionally pumped. In fact, this explains why there is a region in the
  –Tk plane where an inversion can occur without the presence of an external radiation field.
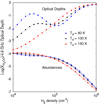 |
Fig. 15 Plot showing |

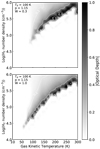 |
Fig. 16 Variation of |τ4.8| in the |

5.3 Evaluation of the results of Baan et al. (2017)
As is shown in Sect. 4.1, using the same set of parameter values as was used by Baan et al. (2017), the population inversion became weaker when Tk approached Td and disappeared completely when Tk = Td. As we show in Fig. 3, the disappearance of the population inversion is most definitely due to the system being in thermodynamic equilibrium when Tk = Td and that a population inversion is not possible in such a case. It can also be seen, especially from Figs. 9 and 10, that the condition Tk < Td as a requirement for an inversion, as set by Baan et al. (2017) (and not by van der Walt 2014, as stated by these authors), does not follow from our results.
The results presented above have some definite implications for interpreting the H2CO megamaser emission presented by Baan et al. (2017). It is first necessary to note that no inversion is found for Tk ≲ 100 K when using a more realistic SED with Td = 59 K for the dust emission (Fig. 6). A direct implication of this result is that, contrary to the conclusions by Baan et al. (2017), the 4.8 GHz H2CO megamasers in the three starburst galaxies are not associated with cold material. Furthermore, if the effect of an upper limit of 10−5 on the abundance of o-H2CO is taken intoaccount (Fig. 16), the implication is that the masers trace hot (100–300 K) gas with densities 105 −106 cm−3 rather than cold gas. Such kinetic temperatures have recently been reported by Gieser et al. (2021) for quite a number of high mass star forming regions. It is fairly well established that the 4.8 GHz masers in the Galaxy are associated exclusively with high mass star forming regions (Araya et al. 2015). There is thus no reason why it should not also be the case for starburst galaxies. In the three starburst galaxies observed by Baan et al. (2017) the 4.8 GHzmaser emission is spatially extended and associated with star forming regions, which by itself suggests the association of these masers with high mass star forming regions as in the case of the Galaxy. Why H2CO maser emission is associated with only three starburst galaxies, and exactly why it is rare in the Galaxy, are questions still to be answered.
6 Conclusions
We performed a new set of numerical calculations to investigate the inversion of the 110 −111 transition of o-H2CO. The calculations covered a significantly larger part of parameter space compared to previous calculations. Considering the results presented above we summarize and conclude as follows:
- 1.
While theoretically there is a population inversion of the 110−111 transition when using a 50 K black-body radiation field, the decrease in the optical depth as the kinetic temperature is increased from 10 to 40 K, as presented if Fig. 19 of Baan et al. (2017), is due to the system approaching thermodynamic equilibrium. This behaviour does not imply that the inversion is the consequence of far-infrared pumping. When a more realistic grey-body SED corresponding to that of Arp 220 is used, no inversion of the 110 −111 transition is found for Tk < 100 K. Our calculations suggest that the megamasers in the three starburst galaxies observed by Baan et al. (2017) are not associated with cold material, but rather with dense and hot gas associated with high mass star formation.
- 2.
We show that, within the framework of our calculations, the 110−111 transition can be inverted without the presence of a far-infrared radiation field. On the other hand, no evidence could be found for the 110−111 transition being inverted by the external dust radiation field (i.e. when collisions are switched off). Collisions therefore seems to play a key role in the pumping mechanism of the masers.
- 3.
We proposed a pumping scheme in which molecules are excited either radiatively or collisionally out of the 111 state. Radiative excitation out of 111 leads to the population of the ladder of lower levels of the doublet states. Population exchange between the ladders of lower and upper doublet states is collisional since radiative coupling between the two ladders is weak. At high H2 densities collisional excitation out of 111 can be to both ladders. Molecules excited collisionally to higher states in the ladder of lower levels of the doublet states still have to be transferred collisionally to the ladder of upper levels of the doublet states. Without collisions, population exchange between the ladders of the lower and upper levels of the doubletstates is extremely slow. Transfer of molecules from the lower levels of the doublet states to the upper levels of the doublet states is necessary since it then provides a fast radiative decay route to 110.
- 4.
When assuming reasonable values for the maser line width and the maser path length it is found that, over most of parameter space where theoretically an inversion can occur, the required abundance of H2CO is significantly larger than observed and predicted by models. Limiting the H2CO abundance to less than 10−5 significantly reduces the region in the
 –Tk
plane where an inversion can occur to a rather narrow region with H2
densities greater than ~105 cm−3
and Tk ≳ 100 K. This might explain the rarity of the H2CO masers in the Galaxy and starburst galaxies.
–Tk
plane where an inversion can occur to a rather narrow region with H2
densities greater than ~105 cm−3
and Tk ≳ 100 K. This might explain the rarity of the H2CO masers in the Galaxy and starburst galaxies.
We finally pointout that o-H2CO has several submillimeter transitions between excited states (for which Eupper > 100 K) which can be used to probe the physical conditions of the environments of the H2CO masers. Dedicated high resolution observations of these transitions can be used to test the predictions of our model calculations.
Acknowledgements
This work is based on research supported in part by the National Research Foundation of South Africa (Grant Numbers 132494).
References
- Araya, E., Baan, W. A., & Hofner, P. 2004, ApJS, 154, 541 [NASA ADS] [CrossRef] [Google Scholar]
- Araya, E. D., Hofner, P., Goss, W. M., et al. 2008, ApJS, 178, 330 [NASA ADS] [CrossRef] [Google Scholar]
- Araya, E. D., Olmi, L., Morales Ortiz, J., et al. 2015, ApJS, 221, 10 [Google Scholar]
- Baan, W. A., Guesten, R., & Haschick, A. D. 1986, ApJ, 305, 830 [NASA ADS] [CrossRef] [Google Scholar]
- Baan, W. A., An, T., Klöckner, H.-R., & Thomasson, P. 2017, MNRAS, 469, 916 [NASA ADS] [CrossRef] [Google Scholar]
- Barbosa, C. L., Blum, R. D., Damineli, A., Conti, P. S., & Gusmão, D. M. 2016, ApJ, 825, 54 [NASA ADS] [CrossRef] [Google Scholar]
- Boland, W., & de Jong, T. 1981, A&A, 98, 149 [NASA ADS] [Google Scholar]
- Cragg, D. M., Sobolev, A. M., & Godfrey, P. D. 2002, MNRAS, 331, 521 [CrossRef] [Google Scholar]
- Downes, D., & Eckart, A. 2007, A&A, 468, L57 [NASA ADS] [CrossRef] [EDP Sciences] [Google Scholar]
- Gieser, C., Beuther, H., Semenov, D., et al. 2021, A&A, 648, A66 [EDP Sciences] [Google Scholar]
- Ginsburg, A., Darling, J., Battersby, C., Zeiger, B., & Bally, J. 2011, ApJ, 736, 149 [NASA ADS] [CrossRef] [Google Scholar]
- Ginsburg, A., Walsh, A., Henkel, C., et al. 2015, A&A, 584, L7 [NASA ADS] [CrossRef] [EDP Sciences] [Google Scholar]
- Green, J. A., Breen, S. L., Fuller, G. A., et al. 2017, MNRAS, 469, 1383 [Google Scholar]
- Guzmán, V., Pety, J., Goicoechea, J. R., Gerin, M., & Roueff, E. 2011, A&A, 534, A49 [NASA ADS] [CrossRef] [EDP Sciences] [Google Scholar]
- Kraemer, K. E., Jackson, J. M., Deutsch, L. K., et al. 2001, ApJ, 561, 282 [NASA ADS] [CrossRef] [Google Scholar]
- Lim, W., & De Buizer, J. M. 2019, ApJ, 873, 51 [NASA ADS] [CrossRef] [Google Scholar]
- Lu, X., Mills, E. A. C., Ginsburg, A., et al. 2019, ApJS, 244, 35 [Google Scholar]
- Maret, S., Ceccarelli, C., Caux, E., et al. 2004, A&A, 416, 577 [NASA ADS] [CrossRef] [EDP Sciences] [Google Scholar]
- Nikitin, A. V., Protasevich, A. E., Rodina, A. A., et al. 2021, J. Quant. Spectr. Rad. Transf., 260, 107478 [NASA ADS] [CrossRef] [Google Scholar]
- Schöier, F. L., van der Tak, F. F. S., van Dishoeck, E. F., & Black, J. H. 2005, A&A, 432, 369 [Google Scholar]
- Scoville, N., Sheth, K., Walter, F., et al. 2015, ApJ, 800, 70 [NASA ADS] [CrossRef] [Google Scholar]
- Scoville, N., Murchikova, L., Walter, F., et al. 2017, ApJ, 836, 66 [Google Scholar]
- van der Tak, F. F. S., Black, J. H., Schöier, F. L., Jansen, D. J., & van Dishoeck, E. F. 2007, A&A, 468, 627 [NASA ADS] [CrossRef] [EDP Sciences] [Google Scholar]
- van der Walt, D. J. 2014, A&A, 562, A68 [NASA ADS] [CrossRef] [EDP Sciences] [Google Scholar]
- van Langevelde, H. J., & van der Tak, F. 2008, Radiation Bookkeeping: a guide to astronomical molecular spectroscopy and radiative transfer problems with an emphasis on RADEX, http://var.sron.nl/radex/radex_manual.pdf [Google Scholar]
- Vichietti, R. M., Spada, R. F. K., da Silva, A. B. F., Machado, F. B. C., & Haiduke, R. L. A. 2016, ApJS, 225, 2 [Google Scholar]
- Wiesenfeld, L., & Faure, A. 2013, MNRAS, 432, 2573 [NASA ADS] [CrossRef] [Google Scholar]
- Wilson, C. D., Rangwala, N., Glenn, J., et al. 2014, ApJ, 789, L36 [Google Scholar]
- Yun, M. S., & Carilli, C. L. 2002, ApJ, 568, 88 [NASA ADS] [CrossRef] [Google Scholar]
All Figures
|
Fig. 1 Energy level diagram for the first 40 levels of ortho-formaldehyde. Lower panel: first eight levels with E < 50 K. Upper panel: levels with E > 50 K. The energy scales are different on the y-axes for the lower and upper panels to better separate thedoublet states at lower energies. |
| In the text | |
|
Fig. 2 4.8 GHz optical depth as a function of the H2CO specific column density for |
| In the text | |
|
Fig. 3 Comparison of the level populations for levels |
| In the text | |
|
Fig. 4 Variation in the 4.8 GHz optical depth in the |
| In the text | |
|
Fig. 5 Comparison of a black-body SED with the radio–to–far-infrared SED for Arp 220 (Yun & Carilli 2002). The left vertical dashed line is at 140.8 GHz, which is the frequency for the 313 − 111 transition. The right vertical dashed line is at 2808 GHz, which is the highest transition frequency for the 40 levels. |
| In the text | |
|
Fig. 6 Variation of |τ4.8| in the |
| In the text | |
|
Fig. 7 Variation of |τ4.8| in the |
| In the text | |
|
Fig. 8 Variation of |τ4.8| in the |
| In the text | |
|
Fig. 9 Variation of |τ4.8| in the |
| In the text | |
|
Fig. 10 Variation of |τ4.8| in the |
| In the text | |
|
Fig. 11 Comparison of the variation of |τ4.8| in the |
| In the text | |
|
Fig. 12 Radiative and collision rates of the different energy levels for the lower levels of the doublet states (upper panel) and upper levels of the doublet states (bottom panel). The rates were calculated for Td = 100 K, Tk = 180 K, |
| In the text | |
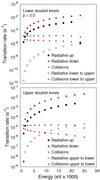 |
Fig. 13 Same as for Fig. 12, but for p = 2.0. |
| In the text | |
|
Fig. 14 Energy level diagram of lower levels of the doublets and the upper levels of the doublets to illustrate the proposed pumping scheme for the 4.8 GHz H2CO masers. Collisions couple the two sets of states. |
| In the text | |
|
Fig. 15 Plot showing |
| In the text | |
|
Fig. 16 Variation of |τ4.8| in the |
| In the text | |
Current usage metrics show cumulative count of Article Views (full-text article views including HTML views, PDF and ePub downloads, according to the available data) and Abstracts Views on Vision4Press platform.
Data correspond to usage on the plateform after 2015. The current usage metrics is available 48-96 hours after online publication and is updated daily on week days.
Initial download of the metrics may take a while.