Fig. 16
Download original image
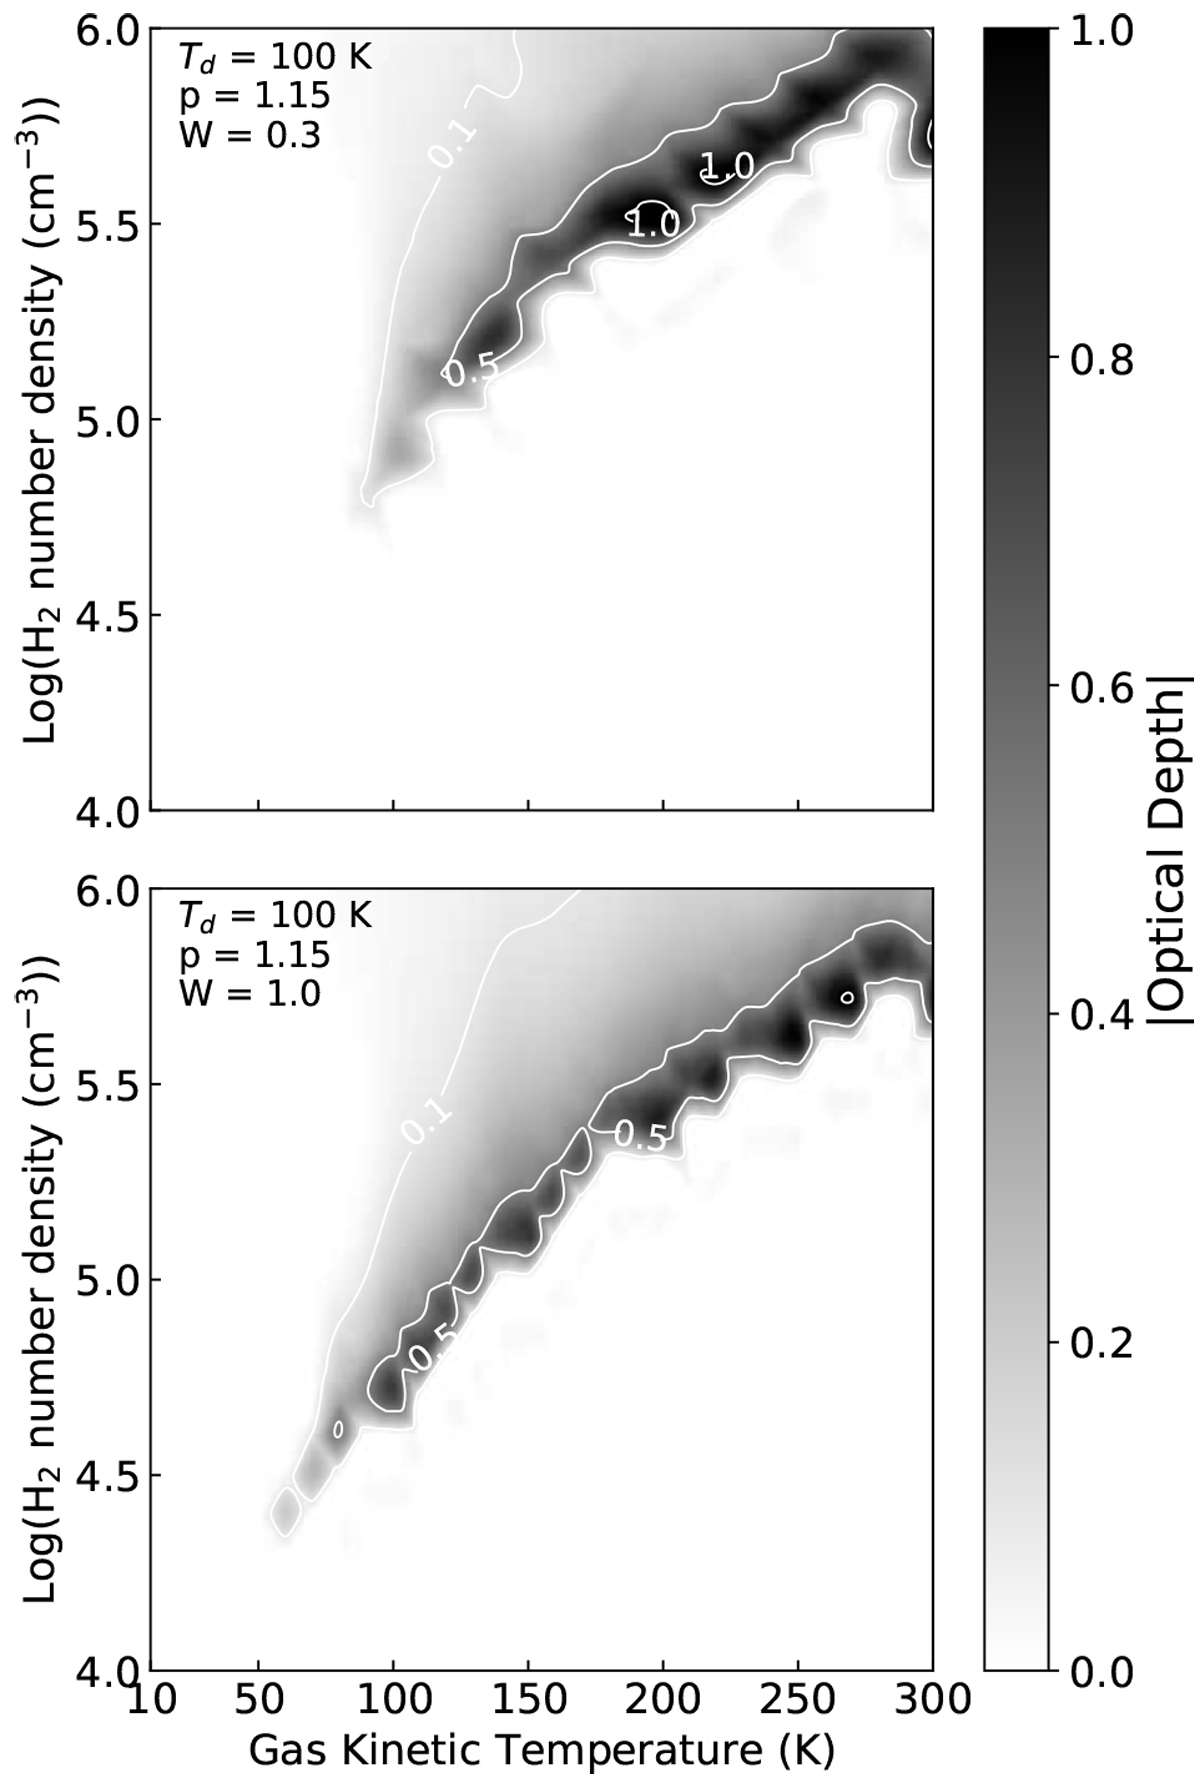
Variation of |τ4.8| in the ![]() –Tk plane, with the SED of the dust emission given by Eq. (2), with p = 1.15 and Td = 100 K and when the H2CO abundance is restricted to be less than 10−5. The upper panel is for W = 0.3 and the lower panel for W = 1. This result should be compared with that shown in Fig. 9 where no upper limit is placed on the H2CO abundance.
–Tk plane, with the SED of the dust emission given by Eq. (2), with p = 1.15 and Td = 100 K and when the H2CO abundance is restricted to be less than 10−5. The upper panel is for W = 0.3 and the lower panel for W = 1. This result should be compared with that shown in Fig. 9 where no upper limit is placed on the H2CO abundance.
Current usage metrics show cumulative count of Article Views (full-text article views including HTML views, PDF and ePub downloads, according to the available data) and Abstracts Views on Vision4Press platform.
Data correspond to usage on the plateform after 2015. The current usage metrics is available 48-96 hours after online publication and is updated daily on week days.
Initial download of the metrics may take a while.