Free Access
Fig. 15
Download original image
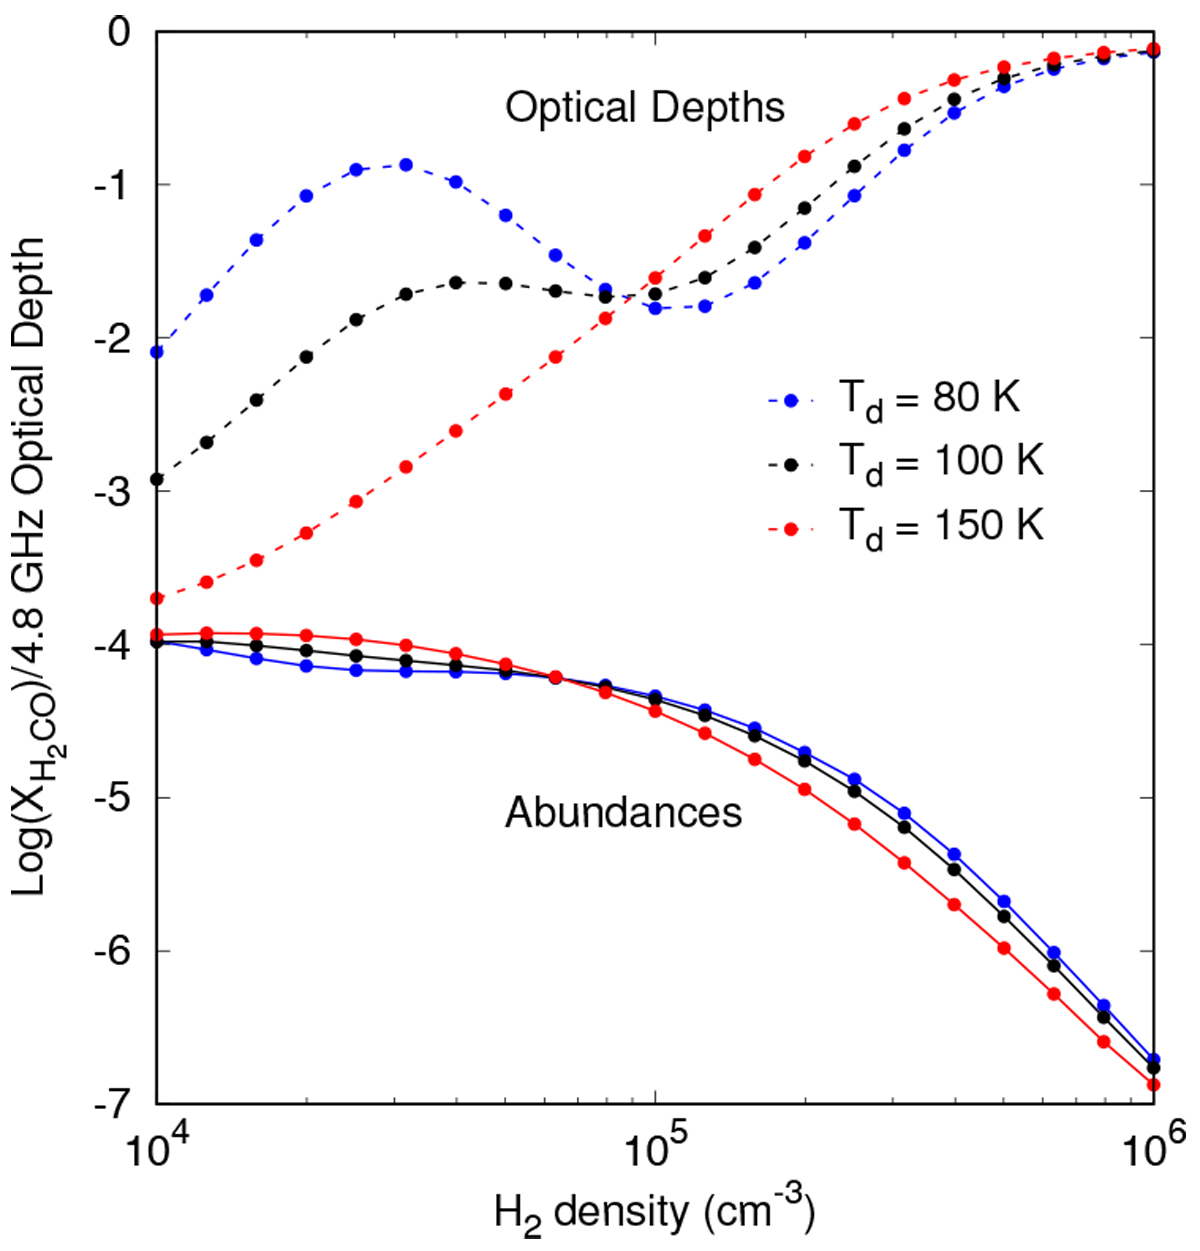
Plot showing ![]() (solid lines) and 4.8 GHz optical depth (dashed lines) as a function of H2 density for Tk = 180 K, p = 1.15, and W = 1 for different dust temperatures. A maser path length of 1017 cm and line width of 1 km s−1 was used to calculate the H2CO abundance.
(solid lines) and 4.8 GHz optical depth (dashed lines) as a function of H2 density for Tk = 180 K, p = 1.15, and W = 1 for different dust temperatures. A maser path length of 1017 cm and line width of 1 km s−1 was used to calculate the H2CO abundance.
Current usage metrics show cumulative count of Article Views (full-text article views including HTML views, PDF and ePub downloads, according to the available data) and Abstracts Views on Vision4Press platform.
Data correspond to usage on the plateform after 2015. The current usage metrics is available 48-96 hours after online publication and is updated daily on week days.
Initial download of the metrics may take a while.