Fig. 6
Download original image
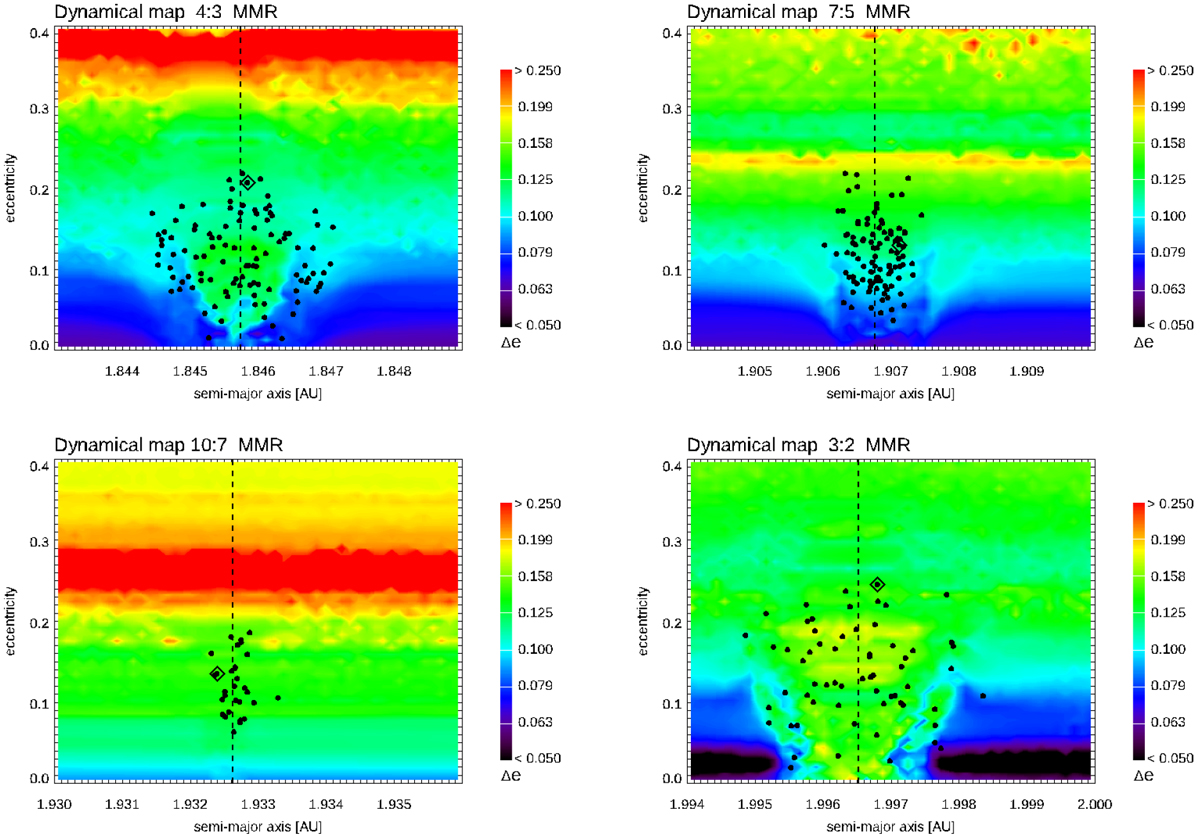
Dynamical maps of the four most populated MMRs using the maximum eccentricity variation as indicator. In the figures, the dots show all asteroids with librating critical argument (involved in short- and long-term libration) in the vicinity of the exact resonance. The diamond represents the asteroid whose clones are used to compile the dynamical map of the corresponding MMR. The vertical dashed line shows the semi-major axis of the exact resonance. In order to visualise thefine structure of the dynamical map, the colour scale is logarithmic, but the eccentricity values in the colour bar are transformed back to linear values. When compiling the dynamical maps for the four MMRs investigated, we use the same colour scale, which guarantees the comparability of these figures.
Current usage metrics show cumulative count of Article Views (full-text article views including HTML views, PDF and ePub downloads, according to the available data) and Abstracts Views on Vision4Press platform.
Data correspond to usage on the plateform after 2015. The current usage metrics is available 48-96 hours after online publication and is updated daily on week days.
Initial download of the metrics may take a while.