Fig. A.1.
Download original image
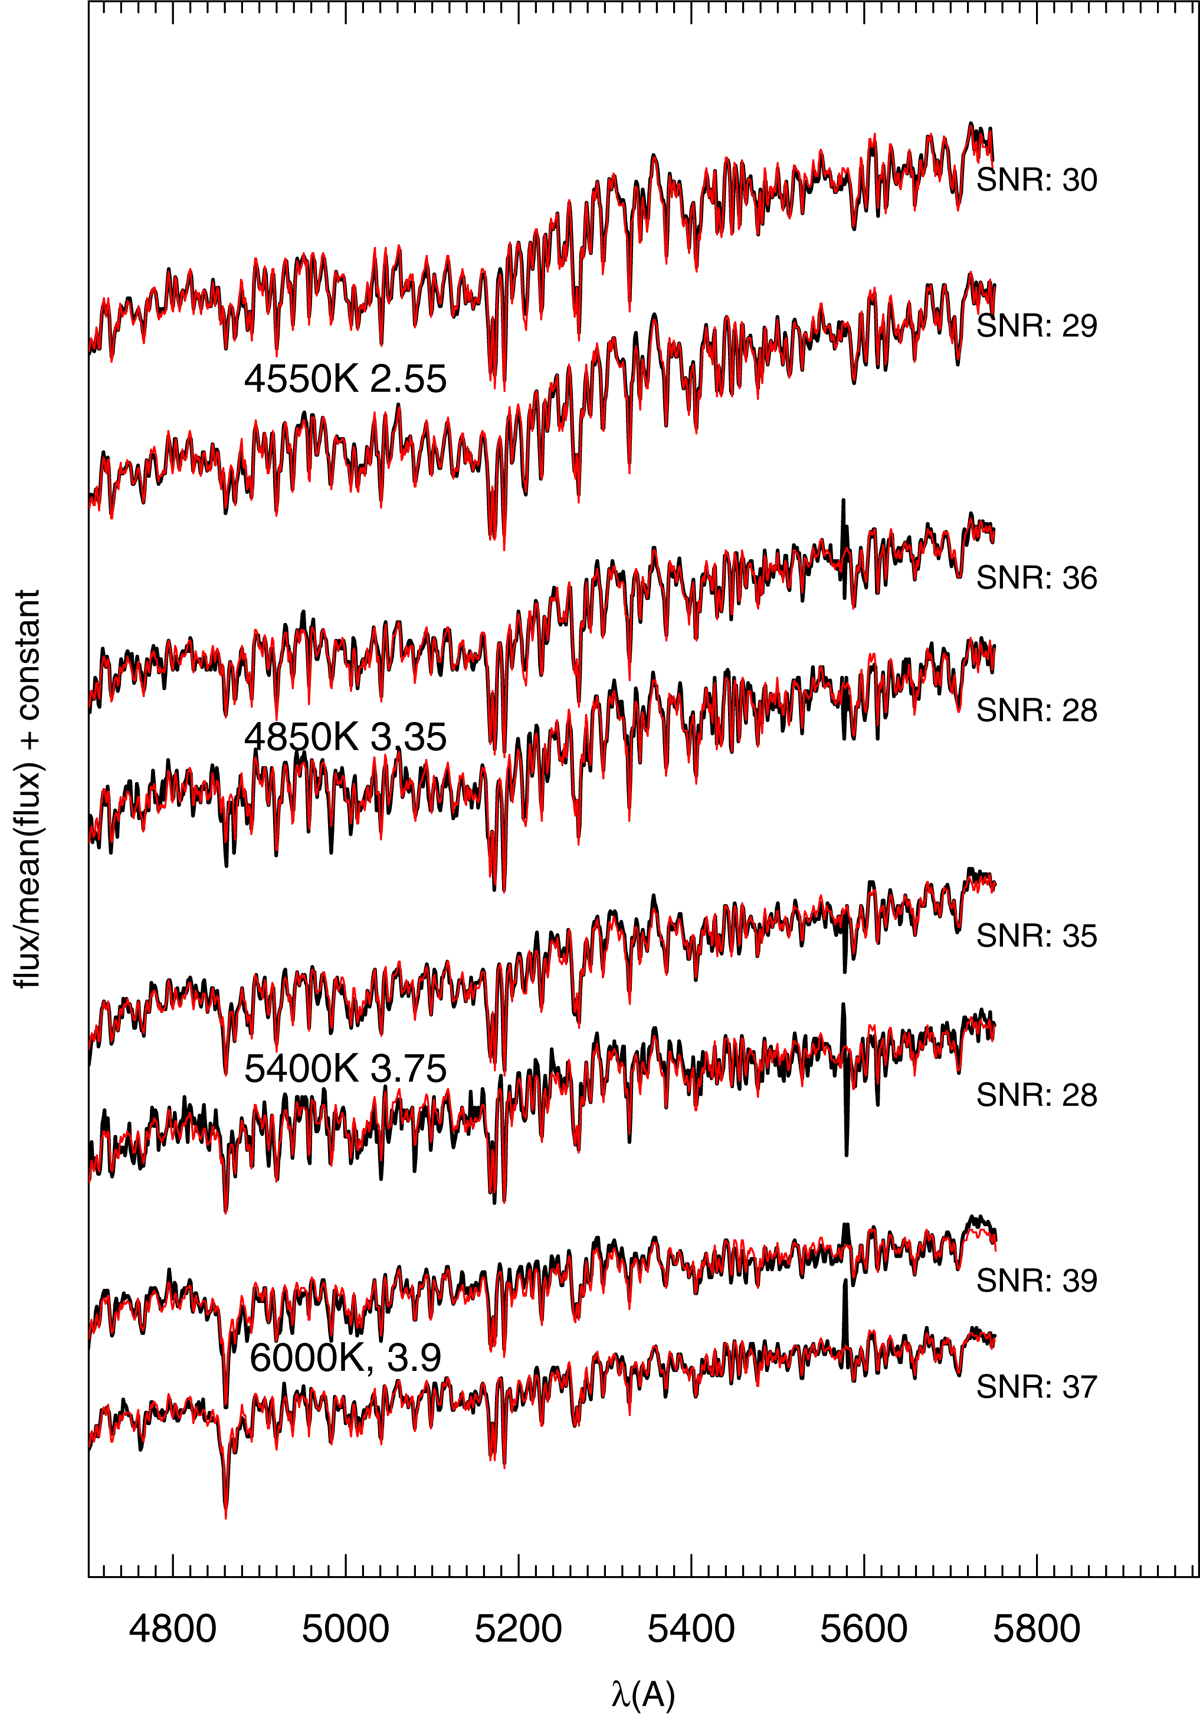
Example of spectra in the visible region, used to fit the atmospheric parameters, of eight selected stars from the FSR 1776 cube (black lines) and the best fit template spectrum from the MILES library (red line). For each combination of these two parameters (text on the left with the approximate Teff and log(g)) a pair of spectra is shown with higher and lower S/N and magnitude, all with similar [Fe/H]∼ + 0.1. From top to bottom, in order of increasing surface gravity and temperature, the pairs represent the RC, lower RGB, SGB, and MS turnoff.
Current usage metrics show cumulative count of Article Views (full-text article views including HTML views, PDF and ePub downloads, according to the available data) and Abstracts Views on Vision4Press platform.
Data correspond to usage on the plateform after 2015. The current usage metrics is available 48-96 hours after online publication and is updated daily on week days.
Initial download of the metrics may take a while.