Fig. 10.
Download original image
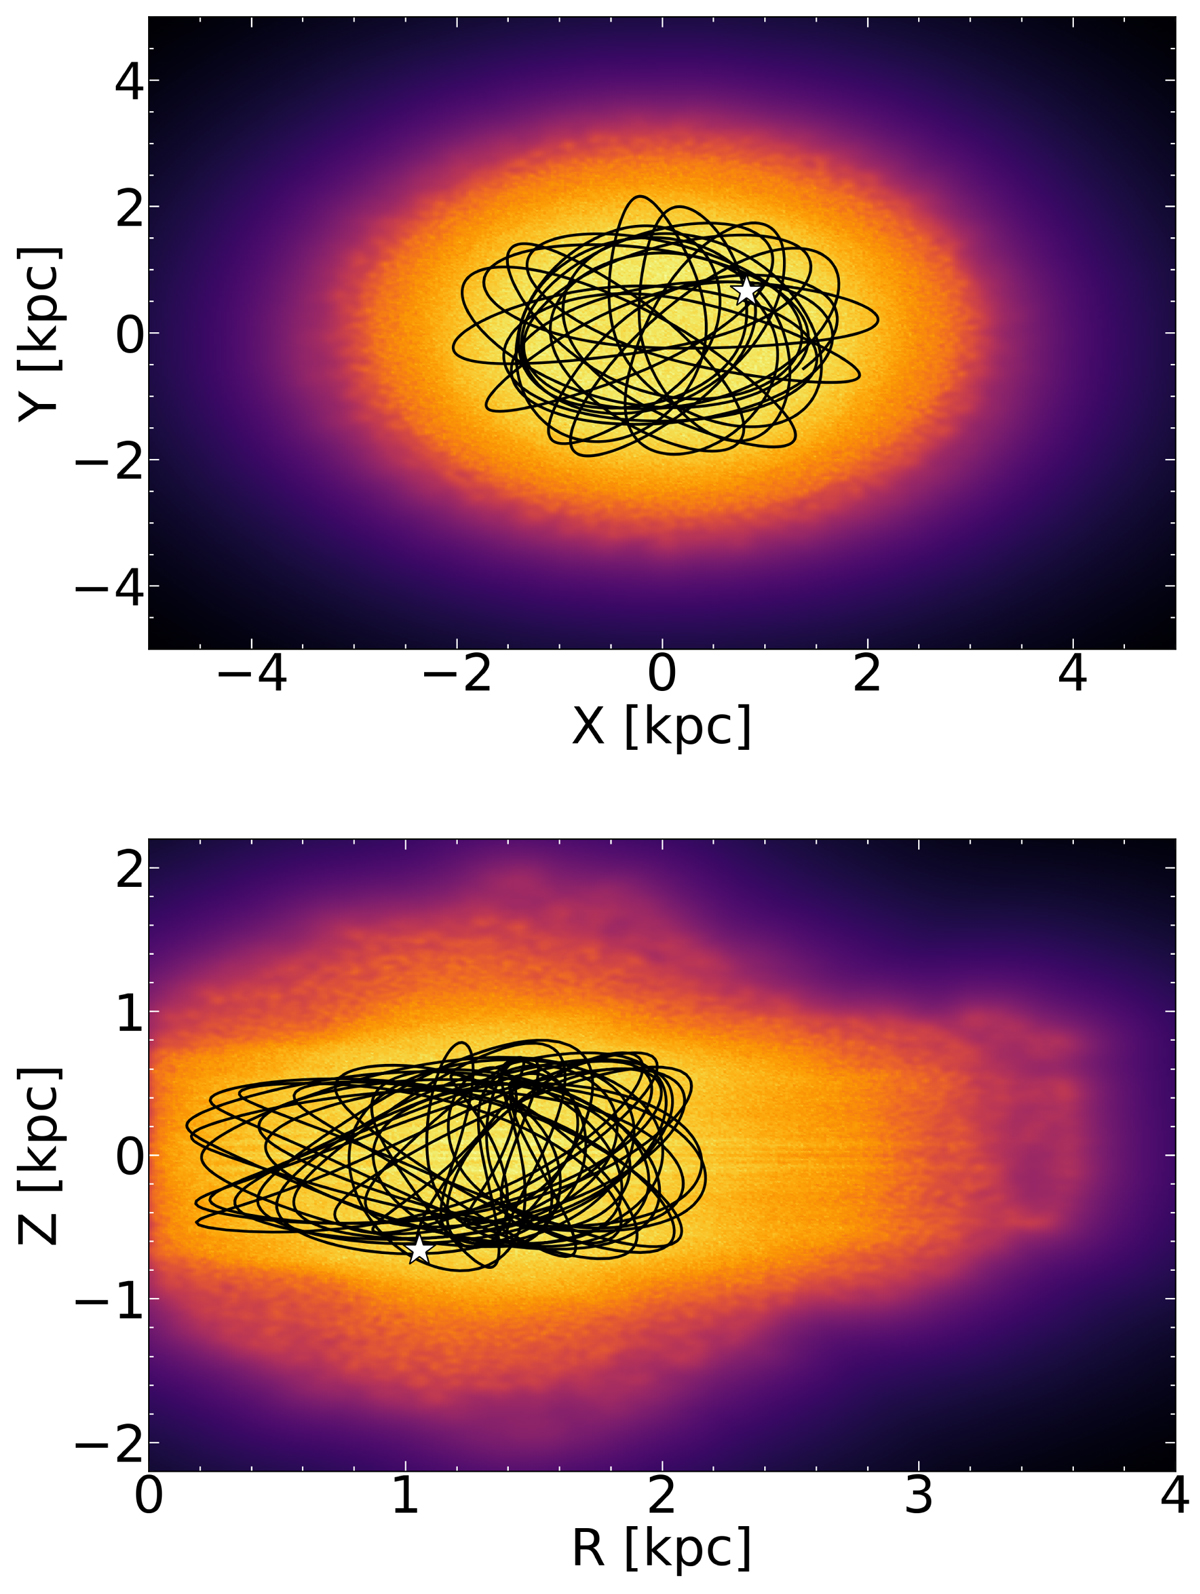
Probability density in the equatorial Galactic plane (top) and side-on (bottom) of 100 000 simulated orbits of FSR 1776 time-integrated backward for 1 Gyr. Yellow–orange corresponds to more probable regions of the space more frequently crossed by the simulated orbits. The black line refers to the cluster orbit computed with the central observable. The white star gives the current position of FSR 1776.
Current usage metrics show cumulative count of Article Views (full-text article views including HTML views, PDF and ePub downloads, according to the available data) and Abstracts Views on Vision4Press platform.
Data correspond to usage on the plateform after 2015. The current usage metrics is available 48-96 hours after online publication and is updated daily on week days.
Initial download of the metrics may take a while.