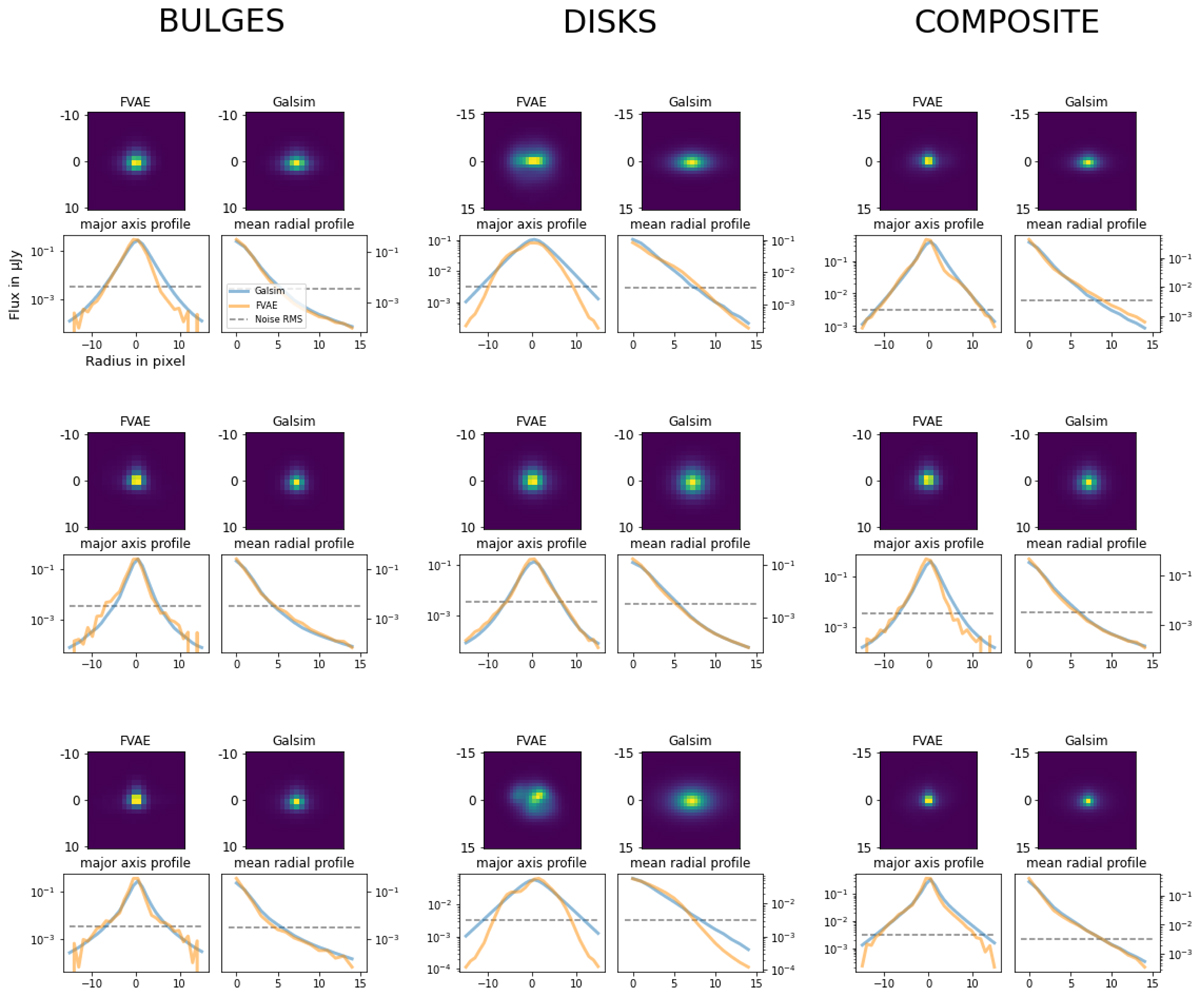
Fig. 8.
Download original image
Examples of three radial profiles of galaxies generated with GalSim and our model. Each group of two columns represents the different components of the galaxy: bulge, disk, and composite (bulge plus disk) from left to right. Within each group the top row shows the images by our model (left) and by the Sérsic model (right). The bottom line represents the light radial profiles, along the major axis (left) and the average profile (right). The orange lines correspond to our model, and blue to the Sérsic profile. The dashed grey line represents the EWS noise level. Our simulations show more diverse profiles, but the average closely matches the analytic expectations. The irregularities at very low S/N on the FVAE profiles are a sign that the model does not produce perfectly noise-free galaxies.
Current usage metrics show cumulative count of Article Views (full-text article views including HTML views, PDF and ePub downloads, according to the available data) and Abstracts Views on Vision4Press platform.
Data correspond to usage on the plateform after 2015. The current usage metrics is available 48-96 hours after online publication and is updated daily on week days.
Initial download of the metrics may take a while.