Fig. 6.
Download original image
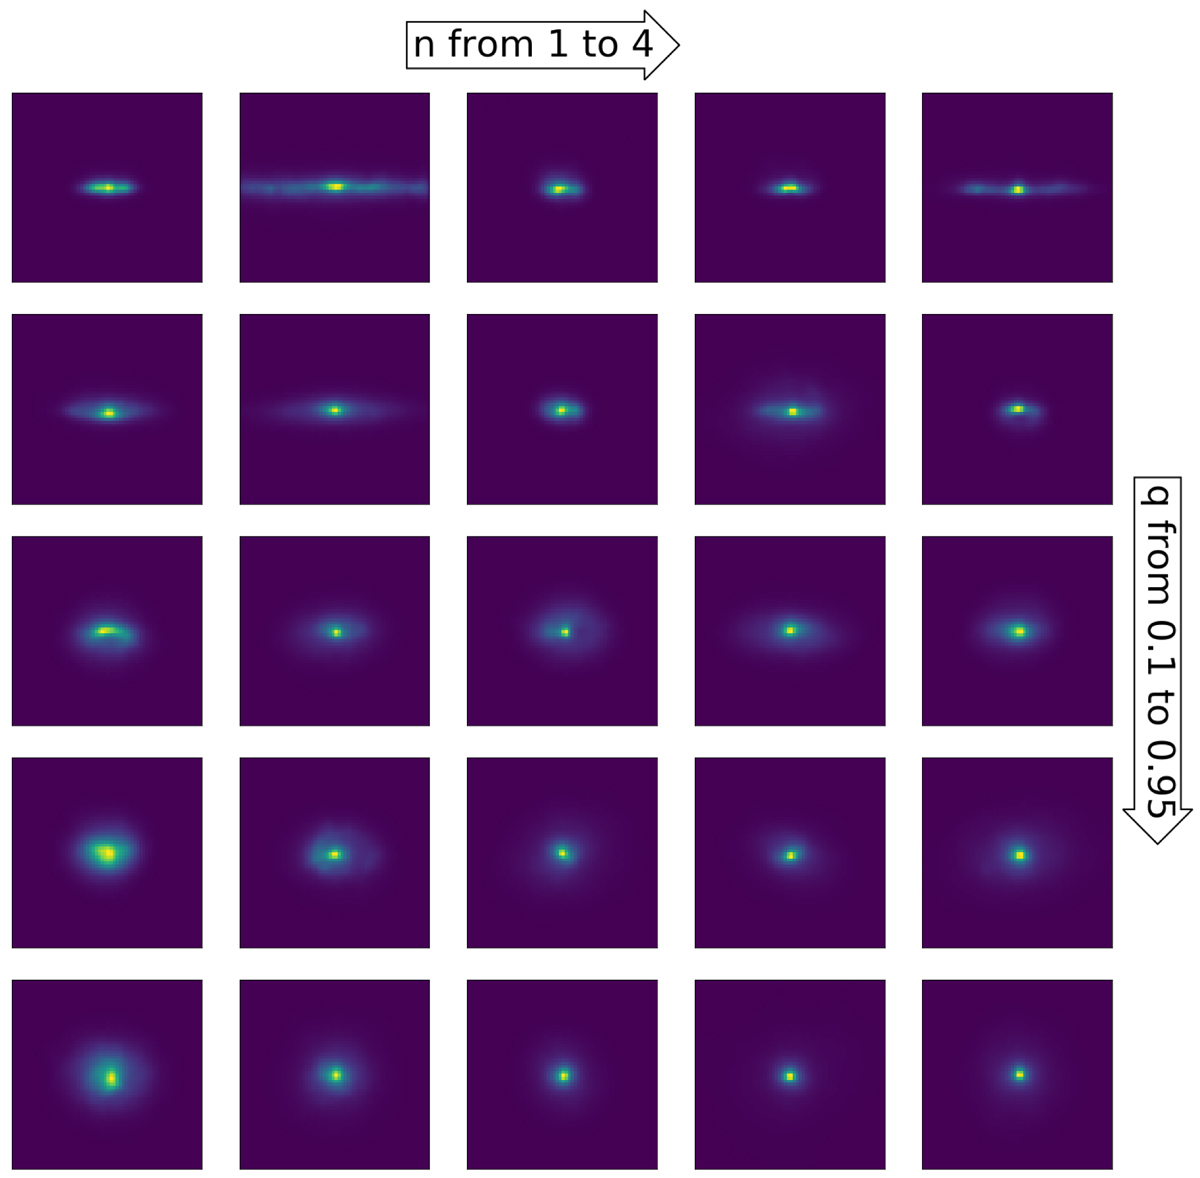
Galaxies simulated by our model from a catalogue with increasing axis ratios (q) and Sérsic indices (n). The magnitude and the effective radius are fixed to 24 and ![]() , respectively, for all galaxies. Each row shows galaxies with constant q, and linearly increasing n from 1 to 4. Each column shows galaxies with fixed n, and linearly increasing q from 0.1 to 0.95. The galaxies clearly show a steeper profile and are rounder from left to right and top to bottom, respectively.
, respectively, for all galaxies. Each row shows galaxies with constant q, and linearly increasing n from 1 to 4. Each column shows galaxies with fixed n, and linearly increasing q from 0.1 to 0.95. The galaxies clearly show a steeper profile and are rounder from left to right and top to bottom, respectively.
Current usage metrics show cumulative count of Article Views (full-text article views including HTML views, PDF and ePub downloads, according to the available data) and Abstracts Views on Vision4Press platform.
Data correspond to usage on the plateform after 2015. The current usage metrics is available 48-96 hours after online publication and is updated daily on week days.
Initial download of the metrics may take a while.