Free Access
Fig. 14
Download original image
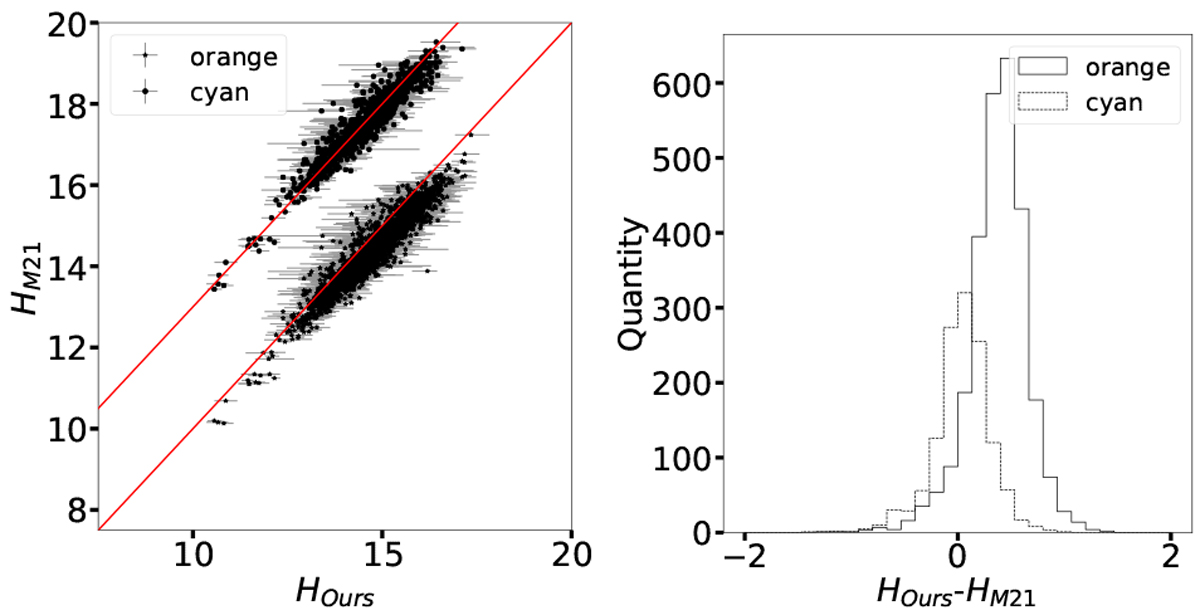
Comparison between this work and M21. Left panel: comparison of HV and HM12. The red line indicates the 1:1 relation. The comparison with the cyan magnitudes were shifted by 3 in the y-axis for clarity. Right panel: distribution of the differences between the obtained H.
Current usage metrics show cumulative count of Article Views (full-text article views including HTML views, PDF and ePub downloads, according to the available data) and Abstracts Views on Vision4Press platform.
Data correspond to usage on the plateform after 2015. The current usage metrics is available 48-96 hours after online publication and is updated daily on week days.
Initial download of the metrics may take a while.