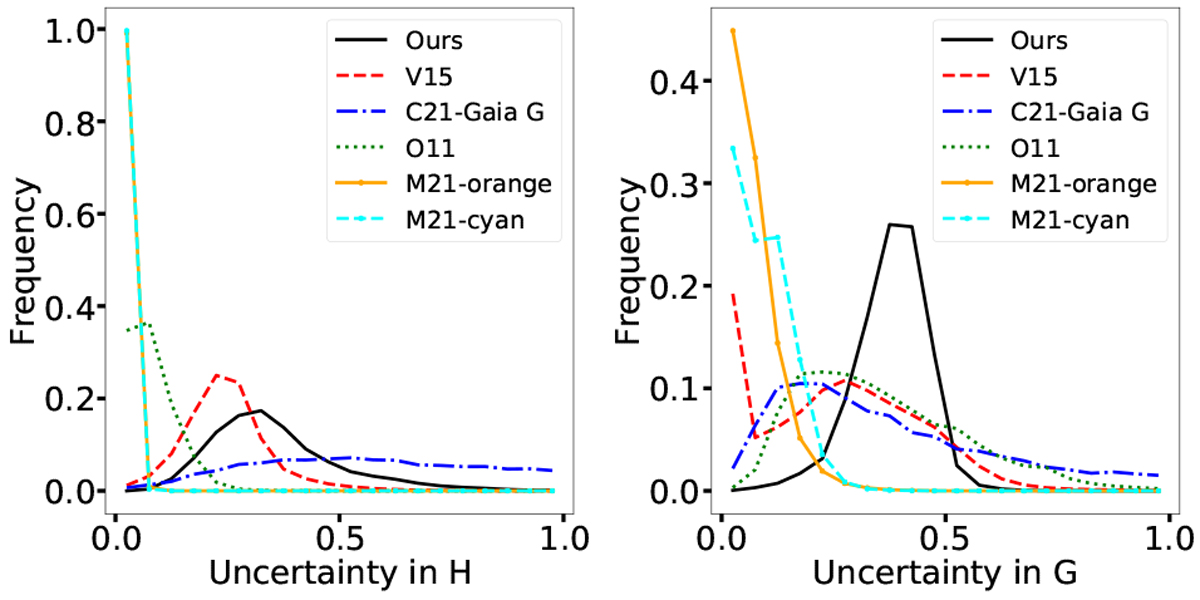
Fig. 10
Download original image
Comparison of the frequency distributions of the uncertainties in H (left panel) and G (right panel) between this work (black continuous line), O11 (green dotted line), V15 (red dashed line), HG of C21 (blue dot-dashed), Hcyan (cyan dashed curve with big dots), and Horange (orange continuous line with big dots), the last two from M21. The x-axes were arbitrarily cut at 1 to exclude large values.
Current usage metrics show cumulative count of Article Views (full-text article views including HTML views, PDF and ePub downloads, according to the available data) and Abstracts Views on Vision4Press platform.
Data correspond to usage on the plateform after 2015. The current usage metrics is available 48-96 hours after online publication and is updated daily on week days.
Initial download of the metrics may take a while.