Fig. 1
Download original image
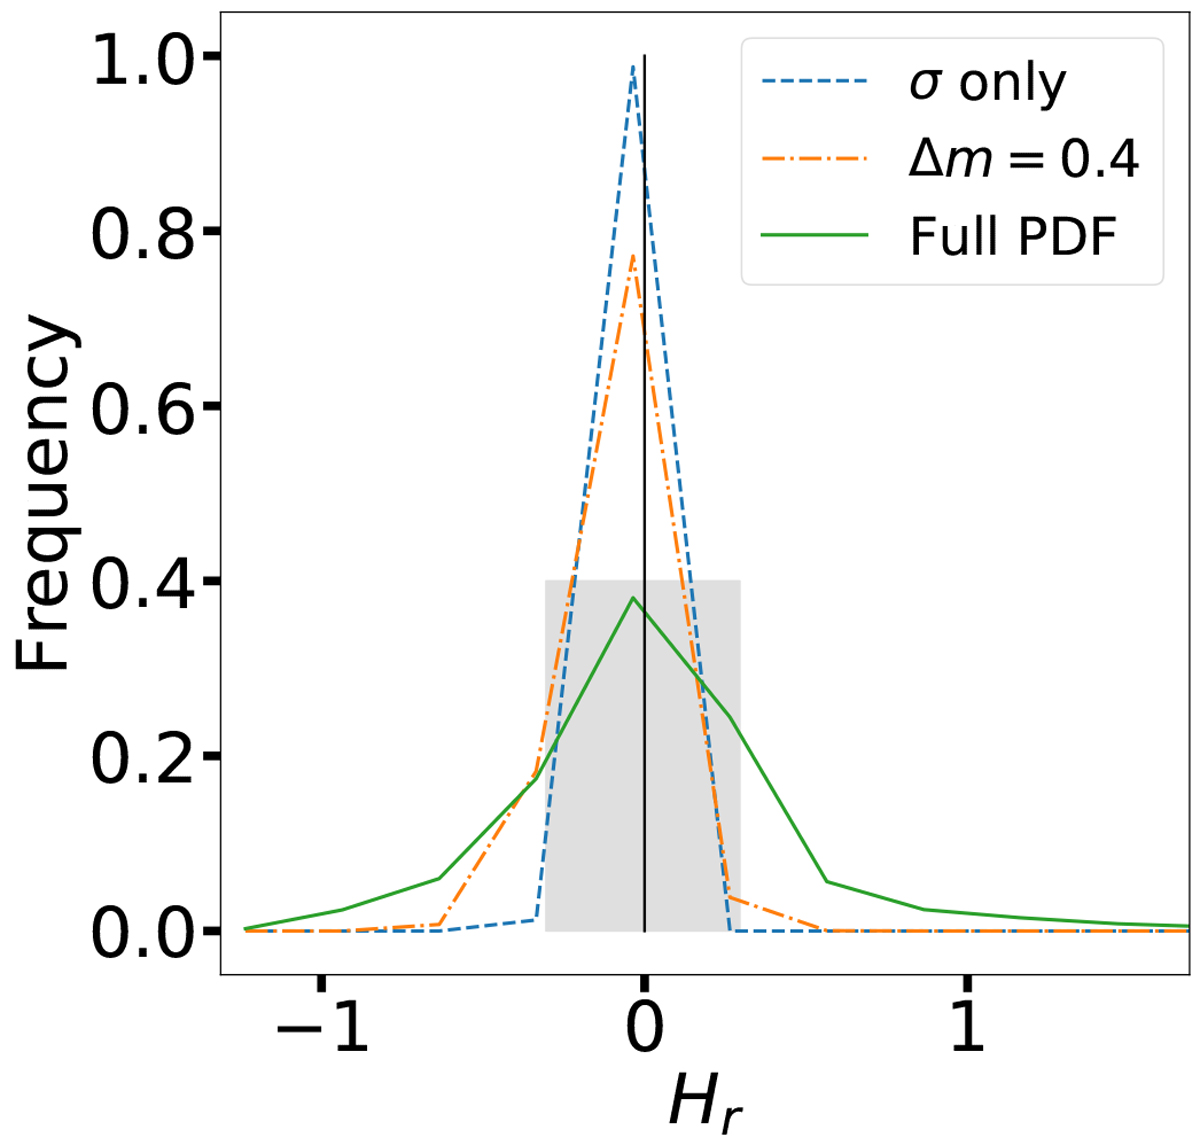
Comparison between three different Probability Distribution Functions for the Hr of 1034 T-1. All distributions are centered at the median value of the magnitude obtained with the Full PDF. The blue dashed line considers only the errors in the magnitude, the orange dot-dashed line considers a single Δm = 0.4, and the continuous green line considers all possible values of Δm and the photometric errors (see text). The black vertical line represents the zero (i.e., the median of the Full PDF), while the shaded area covers the interval where the 68% of the solutions lie in the green curve.
Current usage metrics show cumulative count of Article Views (full-text article views including HTML views, PDF and ePub downloads, according to the available data) and Abstracts Views on Vision4Press platform.
Data correspond to usage on the plateform after 2015. The current usage metrics is available 48-96 hours after online publication and is updated daily on week days.
Initial download of the metrics may take a while.