Free Access
Fig. 8
Download original image
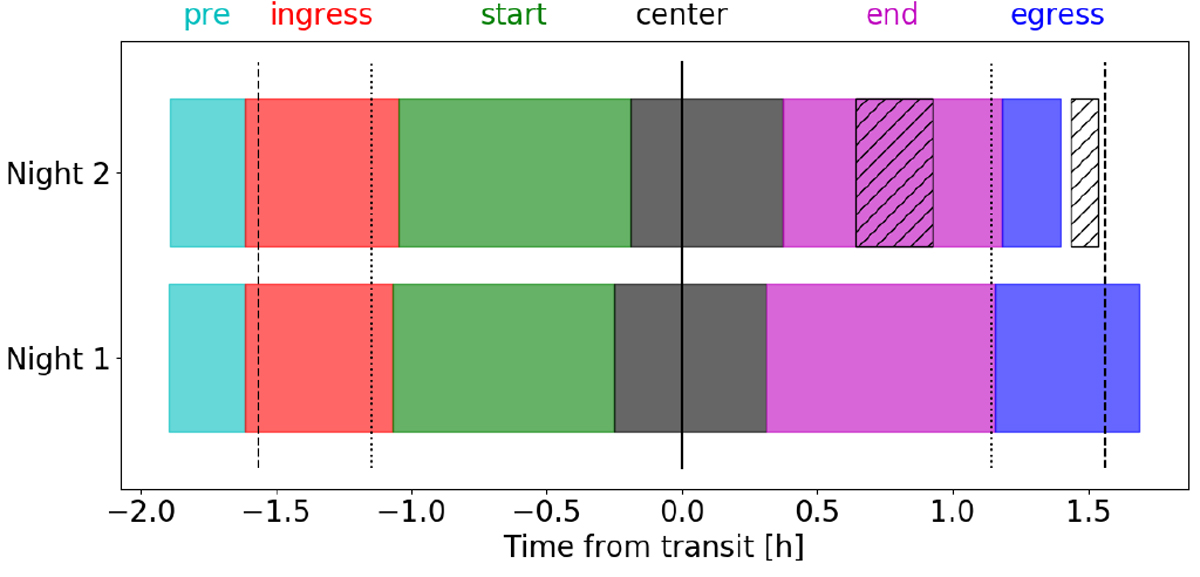
From left to right, the pre, ingress, start, center, end, and egress sections, as indicated by the colored areas. Hatched sections on night 2 refer to technical dropouts. Dashed and dotted lines show the four contact times.
Current usage metrics show cumulative count of Article Views (full-text article views including HTML views, PDF and ePub downloads, according to the available data) and Abstracts Views on Vision4Press platform.
Data correspond to usage on the plateform after 2015. The current usage metrics is available 48-96 hours after online publication and is updated daily on week days.
Initial download of the metrics may take a while.