Fig. C.1
Download original image
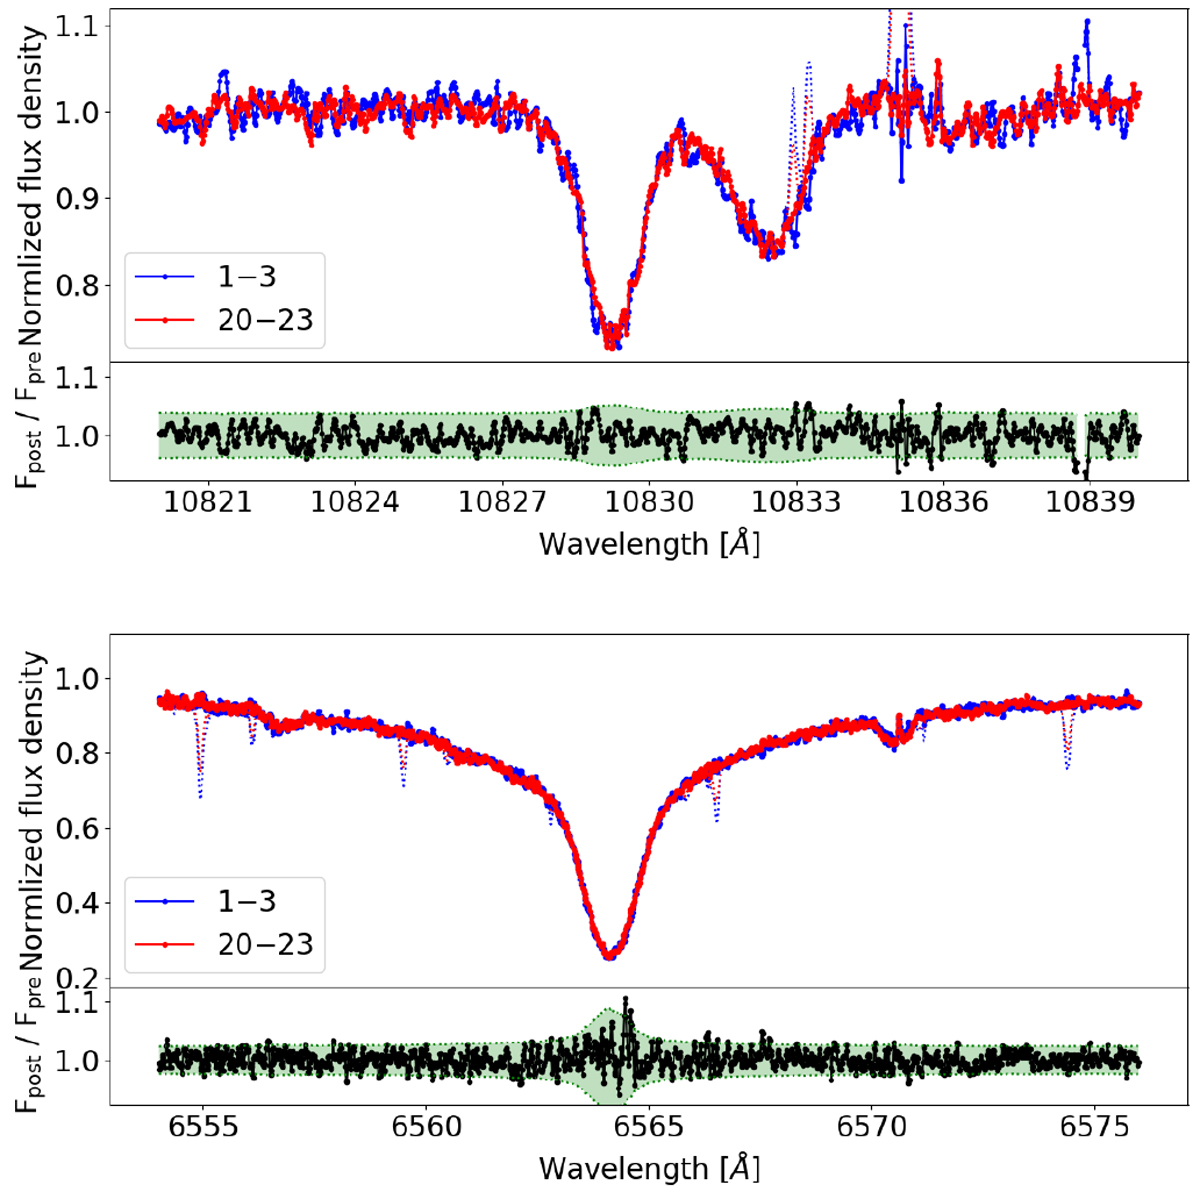
Comparison of pre- and post-transit reference spectra. Top plot, top panel: Averaged, normalized pre-transit spectra (nos. 1,2,3) and post-transit spectra (nos. 20 − 23) around the He Iλ10833 lines during night 1. Dotted lines indicate the averaged spectra obtained without our telluric emission line correction. Top plot, bottom panel shows the ratio of the averaged post- and pre-transit spectra along with an estimate of the 95 % confidencerange resulting from noise (green shades). The bottom panels show the same for the Hα line region.
Current usage metrics show cumulative count of Article Views (full-text article views including HTML views, PDF and ePub downloads, according to the available data) and Abstracts Views on Vision4Press platform.
Data correspond to usage on the plateform after 2015. The current usage metrics is available 48-96 hours after online publication and is updated daily on week days.
Initial download of the metrics may take a while.