Free Access
Fig. B.4
Download original image
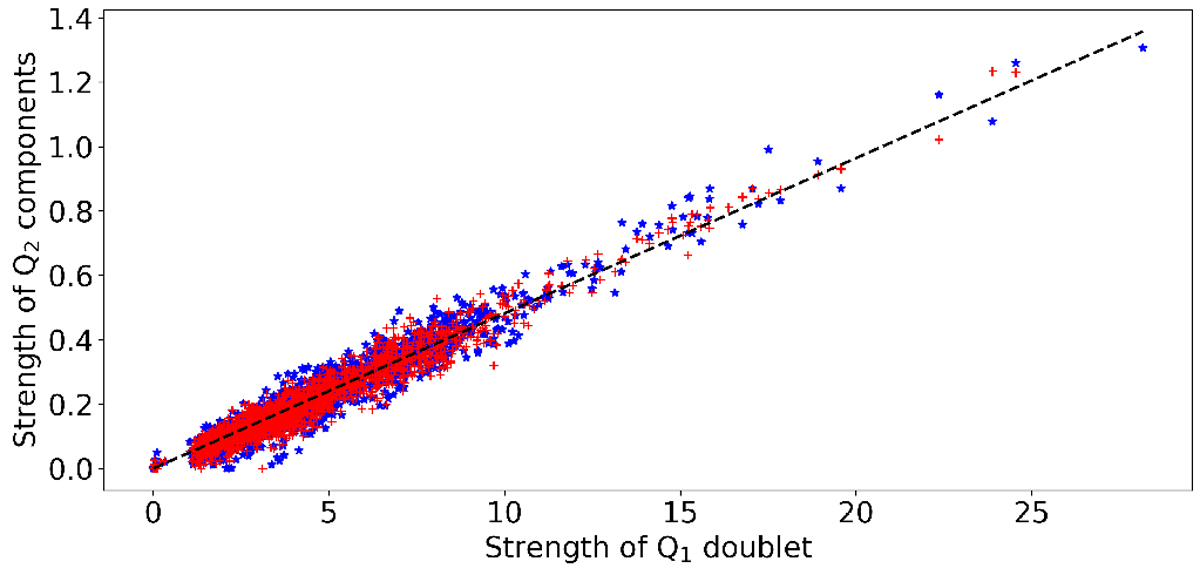
Ratio between strengths of the Gaussian model components representing the Q2 e (blue stars) and Q2f (red pluses) lines and the strength of the combined Q1 components along with best-fit relation (dashed black).
Current usage metrics show cumulative count of Article Views (full-text article views including HTML views, PDF and ePub downloads, according to the available data) and Abstracts Views on Vision4Press platform.
Data correspond to usage on the plateform after 2015. The current usage metrics is available 48-96 hours after online publication and is updated daily on week days.
Initial download of the metrics may take a while.