Free Access
Fig. B.3
Download original image
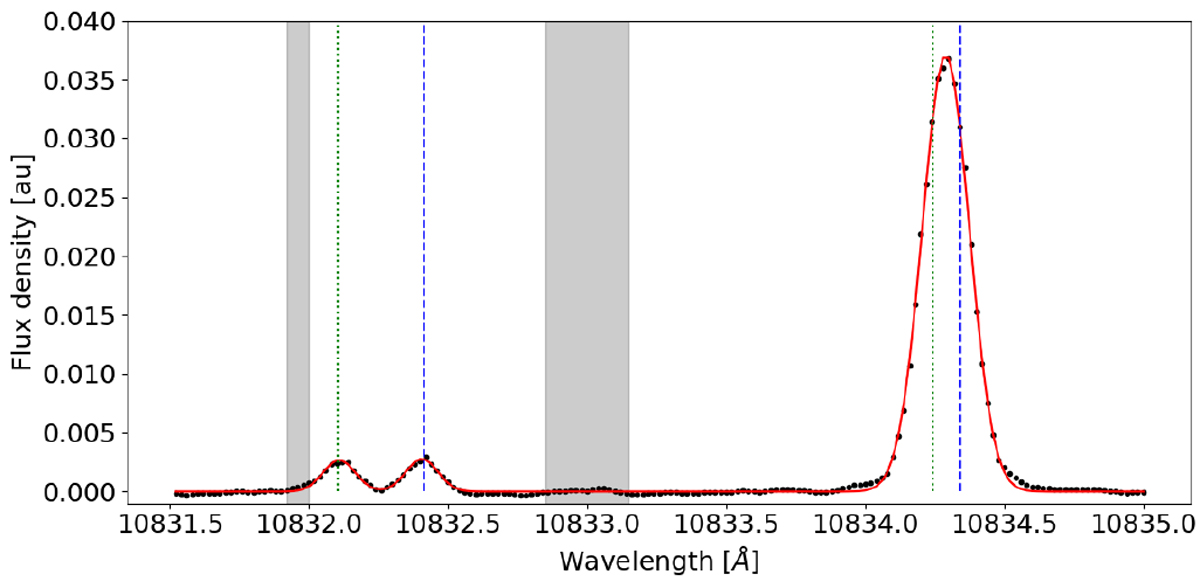
Mean sky spectrum during night 1 (black points) along with best-fit model (solid red line) and wavelengths of the Q1 and Q2 doublet lines according to Oliva et al. (2015) (f-components green dotted, e-components dashed blue vertical lines). Gray-shaded regions are exempted from the fit.
Current usage metrics show cumulative count of Article Views (full-text article views including HTML views, PDF and ePub downloads, according to the available data) and Abstracts Views on Vision4Press platform.
Data correspond to usage on the plateform after 2015. The current usage metrics is available 48-96 hours after online publication and is updated daily on week days.
Initial download of the metrics may take a while.