Free Access
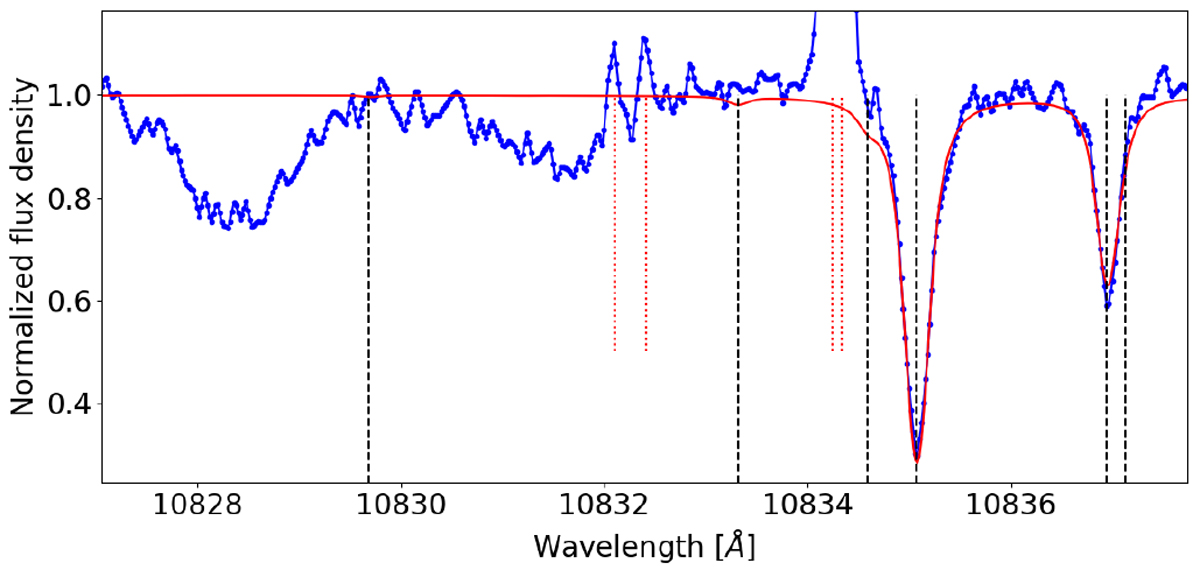
Fig. B.1
Download original image
Excerpt of the first spectrum on night 1 (blue dots) along with telluric absorption model (solid red) and locations of relevant water absorption lines (vertical dashed black). Hydroxide emission lines are indicated by shorter, dotted red lines.
Current usage metrics show cumulative count of Article Views (full-text article views including HTML views, PDF and ePub downloads, according to the available data) and Abstracts Views on Vision4Press platform.
Data correspond to usage on the plateform after 2015. The current usage metrics is available 48-96 hours after online publication and is updated daily on week days.
Initial download of the metrics may take a while.