Fig. 6
Download original image
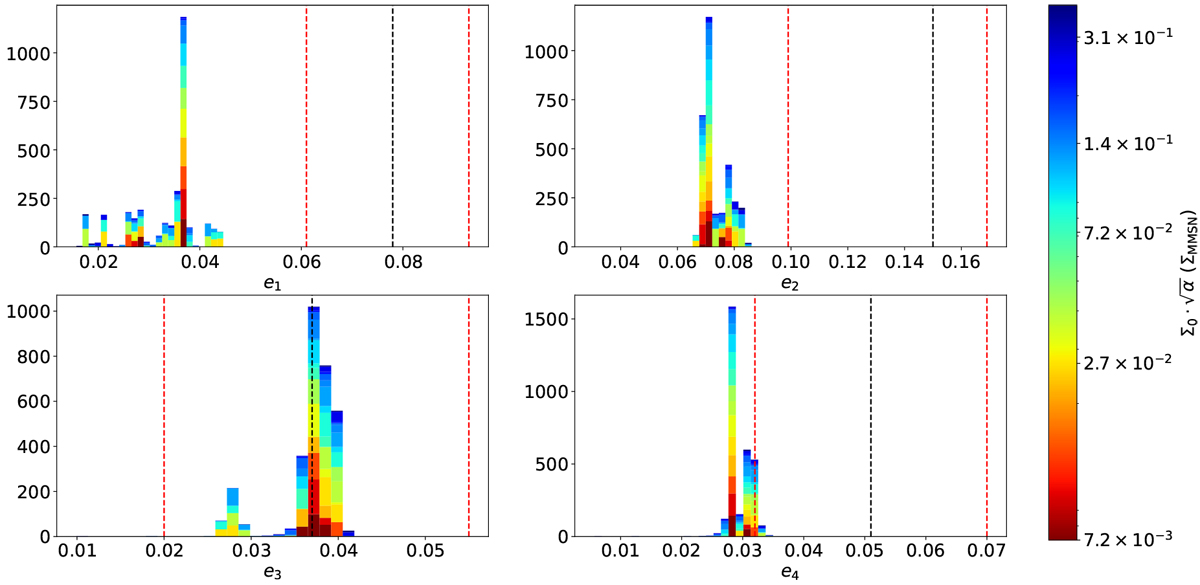
Final averaged planet eccentricities of successfully formed resonant chains, as shown in Fig. 3. The different turbulence strengths ![]() for the individual simulations are indicated by different colors, as shown by the color bar. The dashed black line denotes the expected eccentricities of the planets (Mills et al. 2016), while the dashed red line denotes the 1σ error. For clarity, the range of eccentricities depicted on the abscissa is different for the individual plots. Unlike for the two-planet case, a dependence on turbulence strength and initial separation can be found for this case of four planets, resulting in multiple peaks in the distribution. The eccentricities of the two innermost planets do not match the measured values, while for the outer two planets, an agreement can be found. This is probably related to our implementation of the planet trap at the inner edge of the disk, which does not capture the entire physical scenario (see Sect. 4).
for the individual simulations are indicated by different colors, as shown by the color bar. The dashed black line denotes the expected eccentricities of the planets (Mills et al. 2016), while the dashed red line denotes the 1σ error. For clarity, the range of eccentricities depicted on the abscissa is different for the individual plots. Unlike for the two-planet case, a dependence on turbulence strength and initial separation can be found for this case of four planets, resulting in multiple peaks in the distribution. The eccentricities of the two innermost planets do not match the measured values, while for the outer two planets, an agreement can be found. This is probably related to our implementation of the planet trap at the inner edge of the disk, which does not capture the entire physical scenario (see Sect. 4).
Current usage metrics show cumulative count of Article Views (full-text article views including HTML views, PDF and ePub downloads, according to the available data) and Abstracts Views on Vision4Press platform.
Data correspond to usage on the plateform after 2015. The current usage metrics is available 48-96 hours after online publication and is updated daily on week days.
Initial download of the metrics may take a while.