Fig. 5

Download original image
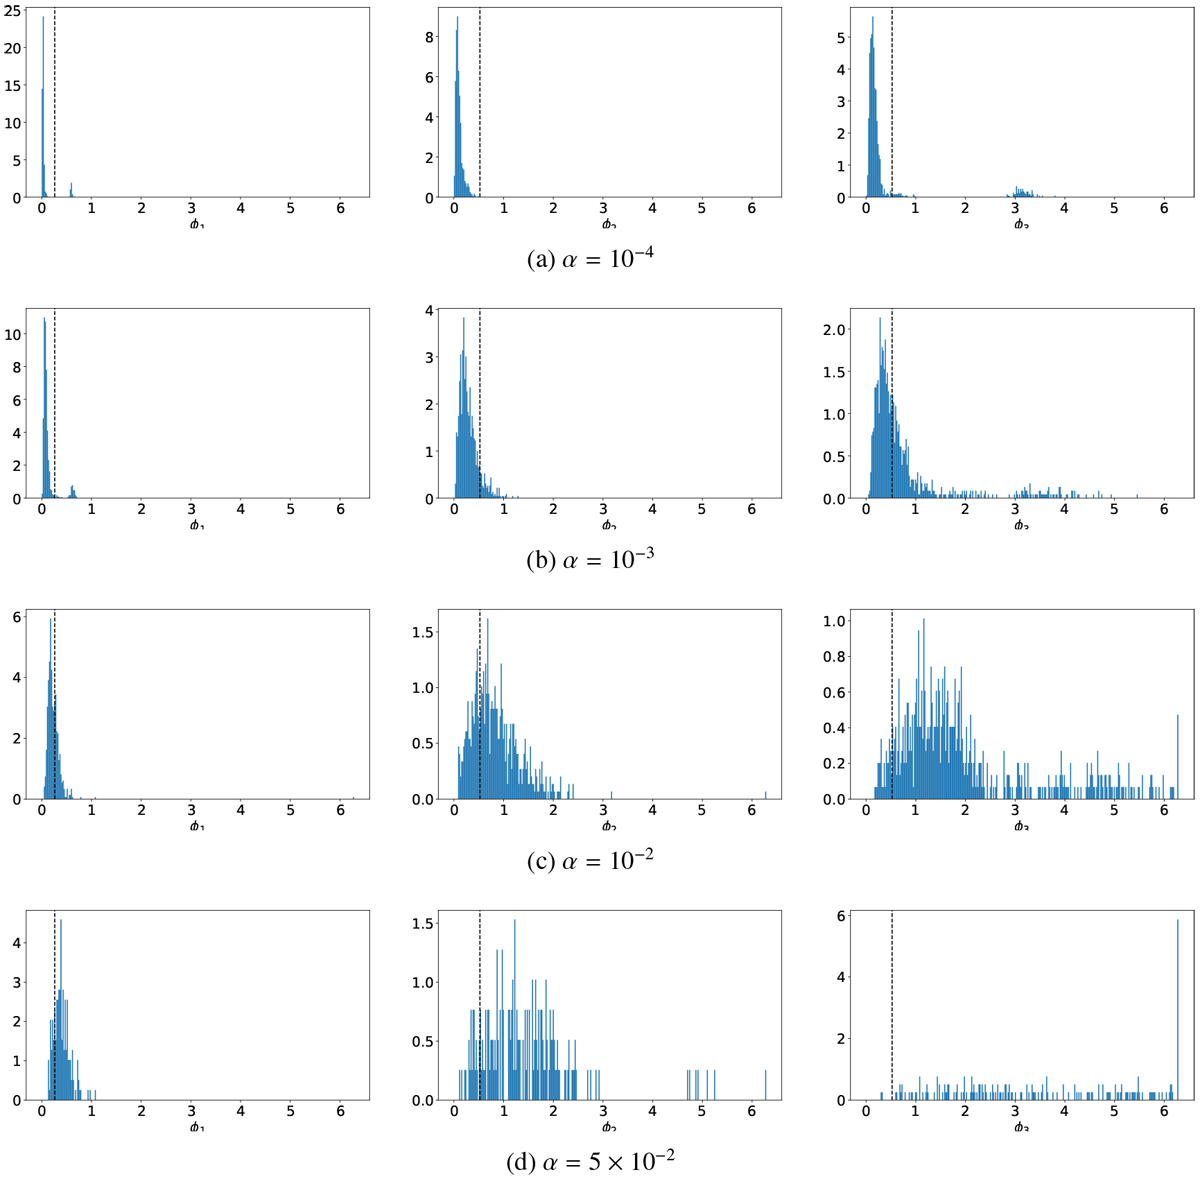
Libration amplitudes of the Laplace angles for successful simulations depicted in Fig. 3, grouped by turbulence strength. The positions of the peaks scale with
![]() , as expected due to De ∝ α, which is the same scaling as for the turbulence strength given by Eq. (13) for a constant surface density Σ0. The expected amplitudes according to Mills et al. (2016) are depicted with dashed black lines. The uncertainties of the amplitudes of the Laplace angles are small and therefore are not depicted for our rough value given by those lines. It is apparent that for the lowest turbulence strength α = ×10−4, the Laplace angle amplitudes are smaller than expected, while for × 10−3 ≤ α ≤×10−2, an agreement between the observed and expected amplitudes can be found. For the highest α = 5 × 10⁻², the amplitudes resulting from the simulations do not match those expected in the case of ϕ3, while for ϕ1 and ϕ2, an agreement can still be found.
, as expected due to De ∝ α, which is the same scaling as for the turbulence strength given by Eq. (13) for a constant surface density Σ0. The expected amplitudes according to Mills et al. (2016) are depicted with dashed black lines. The uncertainties of the amplitudes of the Laplace angles are small and therefore are not depicted for our rough value given by those lines. It is apparent that for the lowest turbulence strength α = ×10−4, the Laplace angle amplitudes are smaller than expected, while for × 10−3 ≤ α ≤×10−2, an agreement between the observed and expected amplitudes can be found. For the highest α = 5 × 10⁻², the amplitudes resulting from the simulations do not match those expected in the case of ϕ3, while for ϕ1 and ϕ2, an agreement can still be found.
Current usage metrics show cumulative count of Article Views (full-text article views including HTML views, PDF and ePub downloads, according to the available data) and Abstracts Views on Vision4Press platform.
Data correspond to usage on the plateform after 2015. The current usage metrics is available 48-96 hours after online publication and is updated daily on week days.
Initial download of the metrics may take a while.


