Fig. 4
Download original image
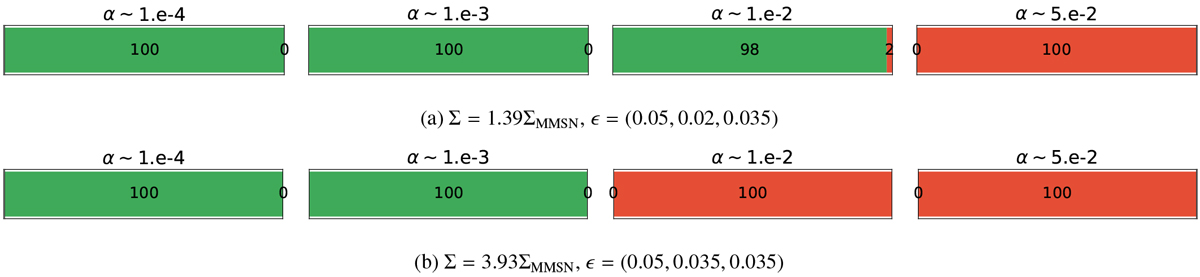
Two setups, also represented in Fig. 3, in which turbulence was activated in the simulations only after the formation of the resonance chain. For case (a), Eq. (19) gives αcrit = 6.4 × 10⁻², and for case (b), it yields αcrit = 2.3 × 10⁻². The resulting number of successful simulations as a function of α is shown, which was compared to the expected critical αcrit value (cf. Eq. (19)). The results match the theoretical expectations on the order of magnitude.
Current usage metrics show cumulative count of Article Views (full-text article views including HTML views, PDF and ePub downloads, according to the available data) and Abstracts Views on Vision4Press platform.
Data correspond to usage on the plateform after 2015. The current usage metrics is available 48-96 hours after online publication and is updated daily on week days.
Initial download of the metrics may take a while.