Fig. 9.
Download original image
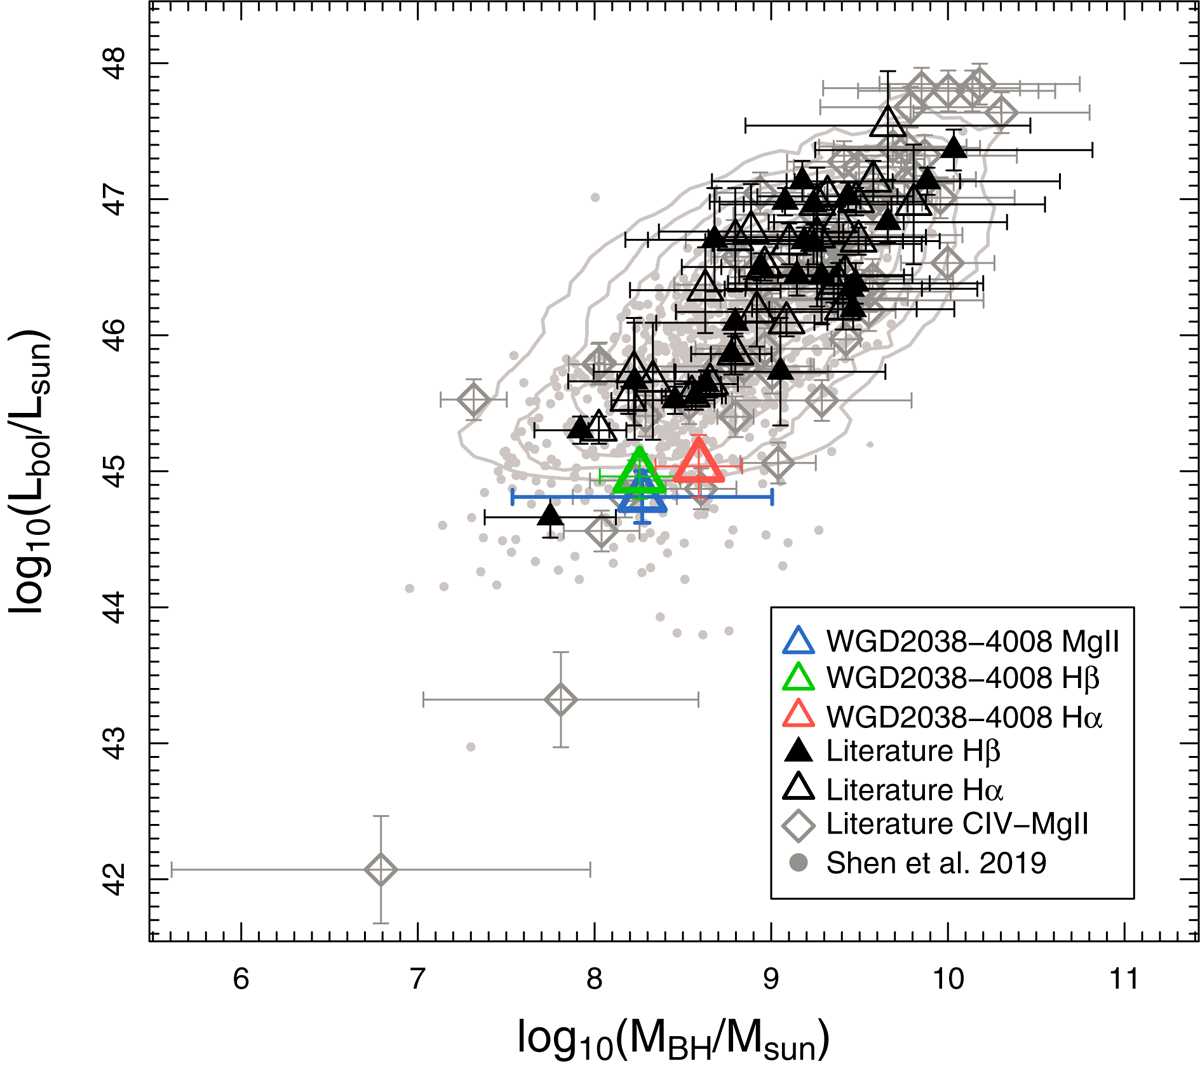
MBH vs. Lbol for quasars. The masses plotted are estimated from different emission lines and monochromatic luminosity found to date (Peng et al. 2006; Assef et al. 2011; Sluse et al. 2012; Ding et al. 2017). For lensed quasars, black open diamonds correspond to the MBH derived from the Mg II and CIV emission lines, black open triangle correspond to the Hα emission line, and black filled triangles to the Hβ emission line. For non-lensed quasars, Shen et al. (2019) data for MBH from SDSS are represented by the gray dots and gray contours. The average MBH mass estimation for WG2038-4008 is represented as blue, red, and green triangles for Mg II, Hβ, and Hα emission lines.
Current usage metrics show cumulative count of Article Views (full-text article views including HTML views, PDF and ePub downloads, according to the available data) and Abstracts Views on Vision4Press platform.
Data correspond to usage on the plateform after 2015. The current usage metrics is available 48-96 hours after online publication and is updated daily on week days.
Initial download of the metrics may take a while.