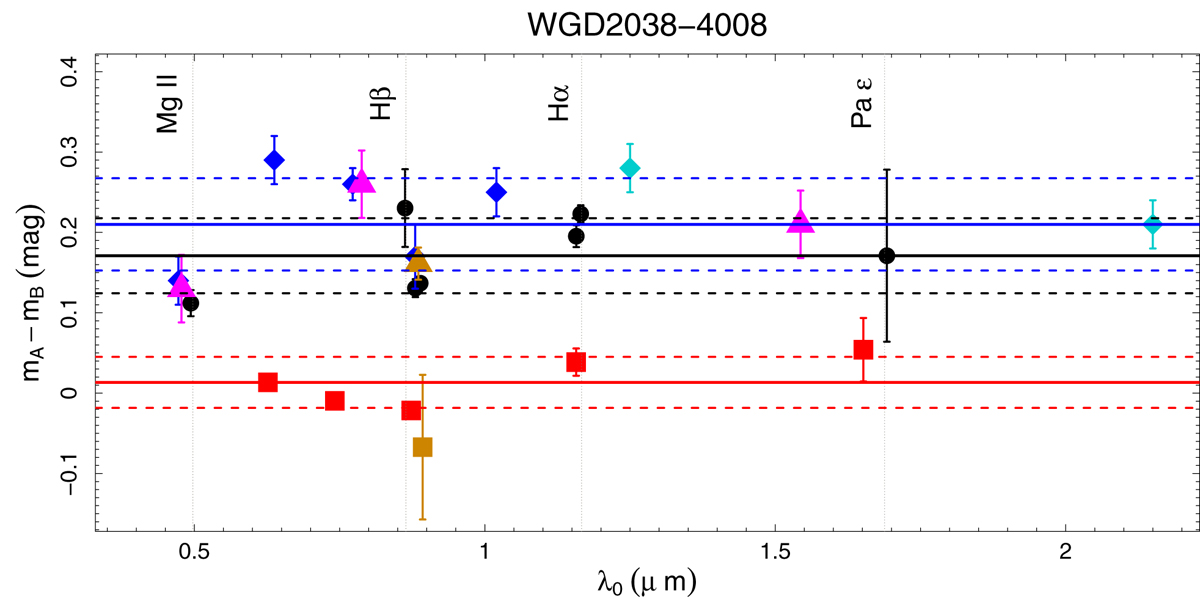
Fig. 8.
Download original image
Magnitude difference mA − mB vs. λ0 between images A and B. The red squares show the integrated continuum and the black circles the emission line core without the continuum using X-shooter. Shown are the measurements obtained from the literature: HST (Shajib et al. 2019) (magenta triangles), VISTA (Lee 2019) (cyan diamonds), DES (Agnello et al. 2018) (blue diamonds) and HST F105W/G102 (Nierenberg et al. 2020) (orange square for continuum and orange triangle for a narrow emission line). The red line is the median of the continuum, the dotted red line the standard deviation, the black line the emission line core, and the blue line the literature.
Current usage metrics show cumulative count of Article Views (full-text article views including HTML views, PDF and ePub downloads, according to the available data) and Abstracts Views on Vision4Press platform.
Data correspond to usage on the plateform after 2015. The current usage metrics is available 48-96 hours after online publication and is updated daily on week days.
Initial download of the metrics may take a while.