Fig. 5.
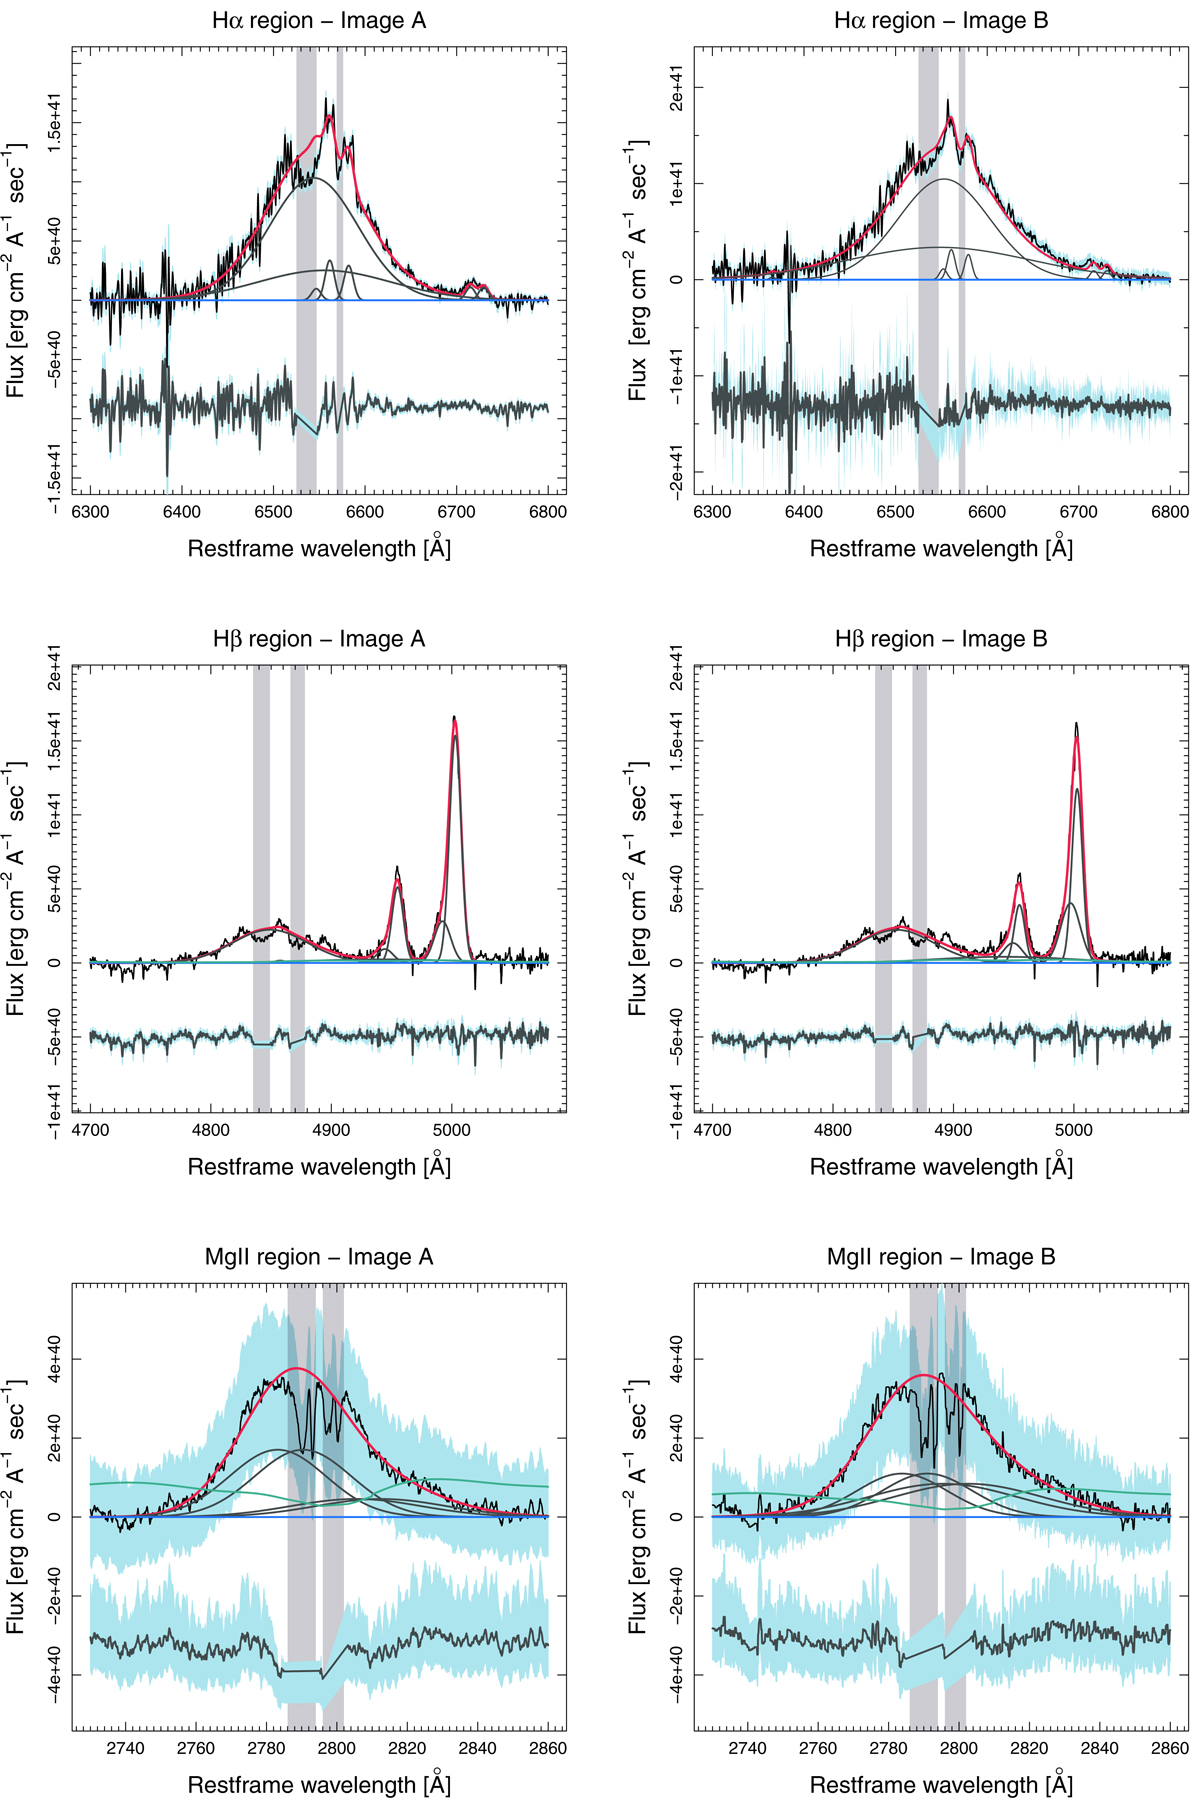
Download original image
Gaussian fitting of Hα, Hβ, and Mg II regions for images A (left) and B (right). The red line represents the best fit, the black lines represent the different components of each region (emission and absorption), the green line represents the Fe template, and the blue line is the continuum fit of the spectra. The 1σ error of the spectra along with the residuals and their respective errors are at the bottom of the images.
Current usage metrics show cumulative count of Article Views (full-text article views including HTML views, PDF and ePub downloads, according to the available data) and Abstracts Views on Vision4Press platform.
Data correspond to usage on the plateform after 2015. The current usage metrics is available 48-96 hours after online publication and is updated daily on week days.
Initial download of the metrics may take a while.