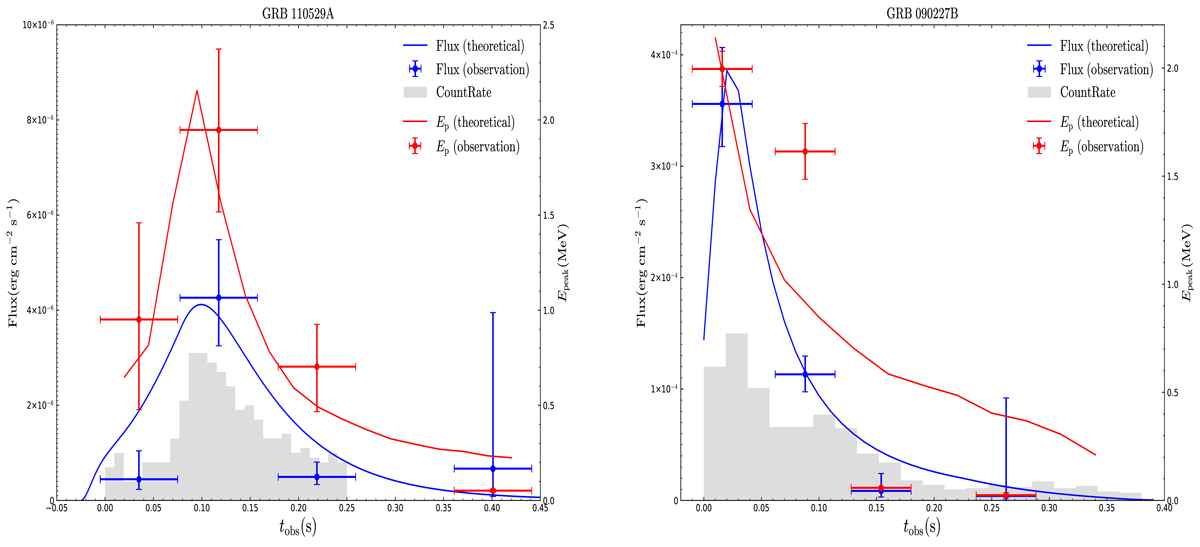
Fig. 4.
Download original image
Theoretical modeling of light curves and Ep evolutions for GRB 110529A and GRB 090227B. In each diagram, numerical results are shown with blue (for flux) and red (for Ep) lines, while the observational data are presented by blue (for flux) and red (for Ep) dots. The gray histogram shows the photon-count light curve in a scaled way.
Current usage metrics show cumulative count of Article Views (full-text article views including HTML views, PDF and ePub downloads, according to the available data) and Abstracts Views on Vision4Press platform.
Data correspond to usage on the plateform after 2015. The current usage metrics is available 48-96 hours after online publication and is updated daily on week days.
Initial download of the metrics may take a while.