Fig. 1.
Download original image
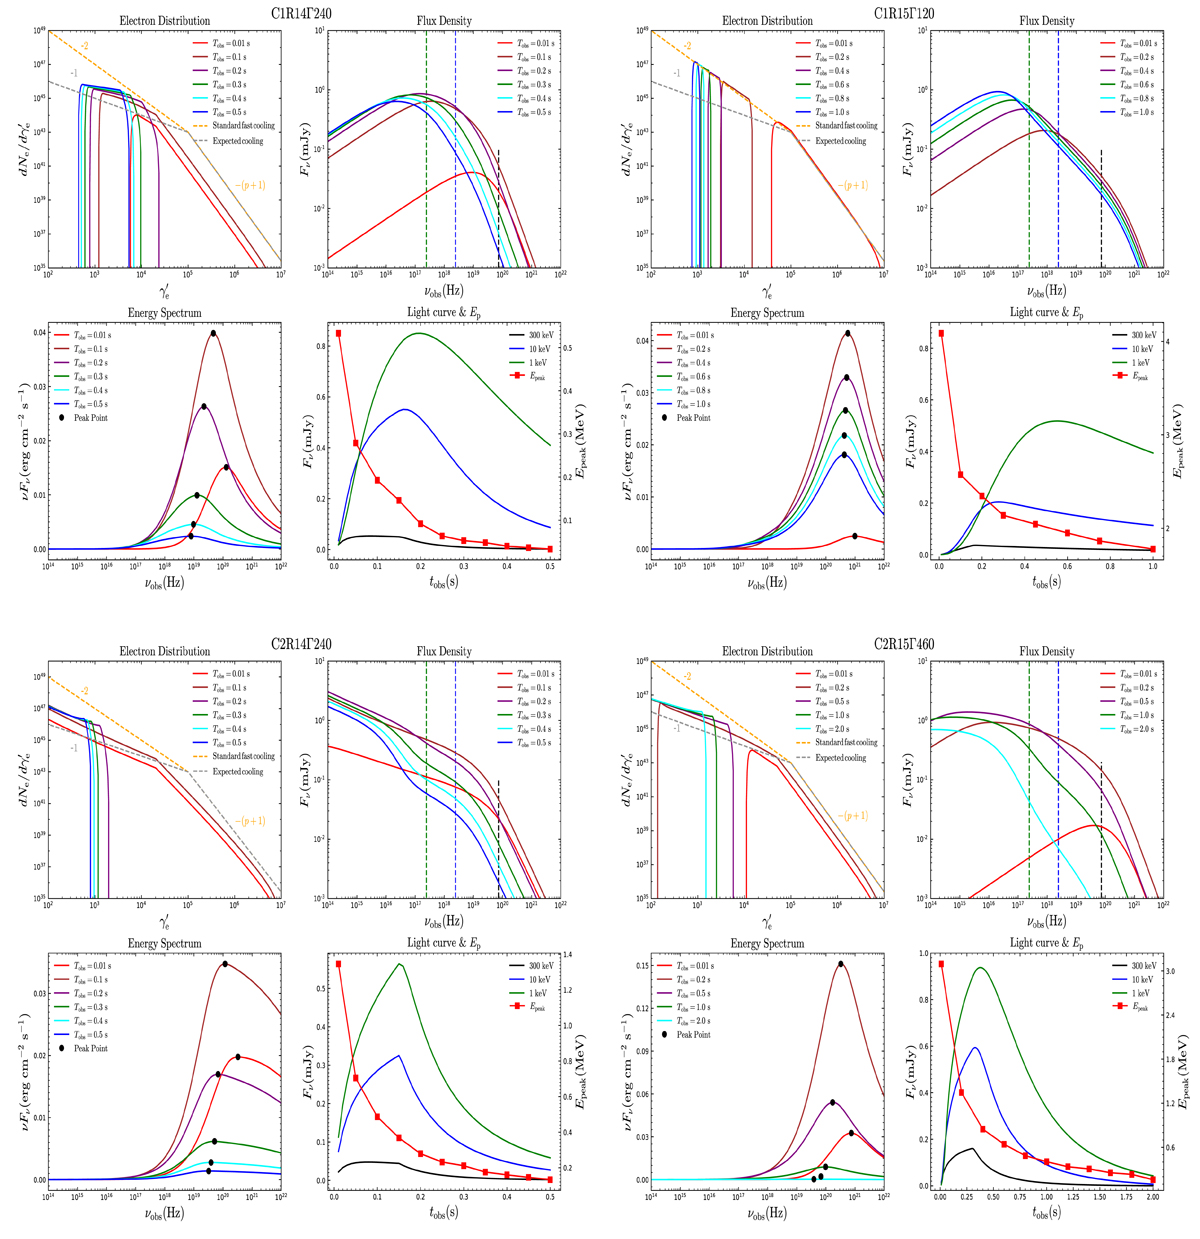
Numerical results for seven cases in the first group shown in Table 1. The diagram of each case consists of four panels: the electron distribution ![]() (upper left), the corresponding synchrotron flux density Fν from electrons (upper right), the spectral energy distribution νFν (lower left), and light curves at three bands and the evolution of Ep (lower right). Notably, in the electron distribution, orange dashed lines are the standard fast-cooling pattern, i.e.,
(upper left), the corresponding synchrotron flux density Fν from electrons (upper right), the spectral energy distribution νFν (lower left), and light curves at three bands and the evolution of Ep (lower right). Notably, in the electron distribution, orange dashed lines are the standard fast-cooling pattern, i.e., ![]() , and gray dashed lines present the expected cooling pattern, i.e.,
, and gray dashed lines present the expected cooling pattern, i.e., ![]() . In the flux density, three vertical lines are given corresponding to three different frequencies of 300 keV, 10 keV, and 1 keV respectively. The peak energy Ep is derived from the peak point of νFν.
. In the flux density, three vertical lines are given corresponding to three different frequencies of 300 keV, 10 keV, and 1 keV respectively. The peak energy Ep is derived from the peak point of νFν.
Current usage metrics show cumulative count of Article Views (full-text article views including HTML views, PDF and ePub downloads, according to the available data) and Abstracts Views on Vision4Press platform.
Data correspond to usage on the plateform after 2015. The current usage metrics is available 48-96 hours after online publication and is updated daily on week days.
Initial download of the metrics may take a while.