Fig. 6
Download original image
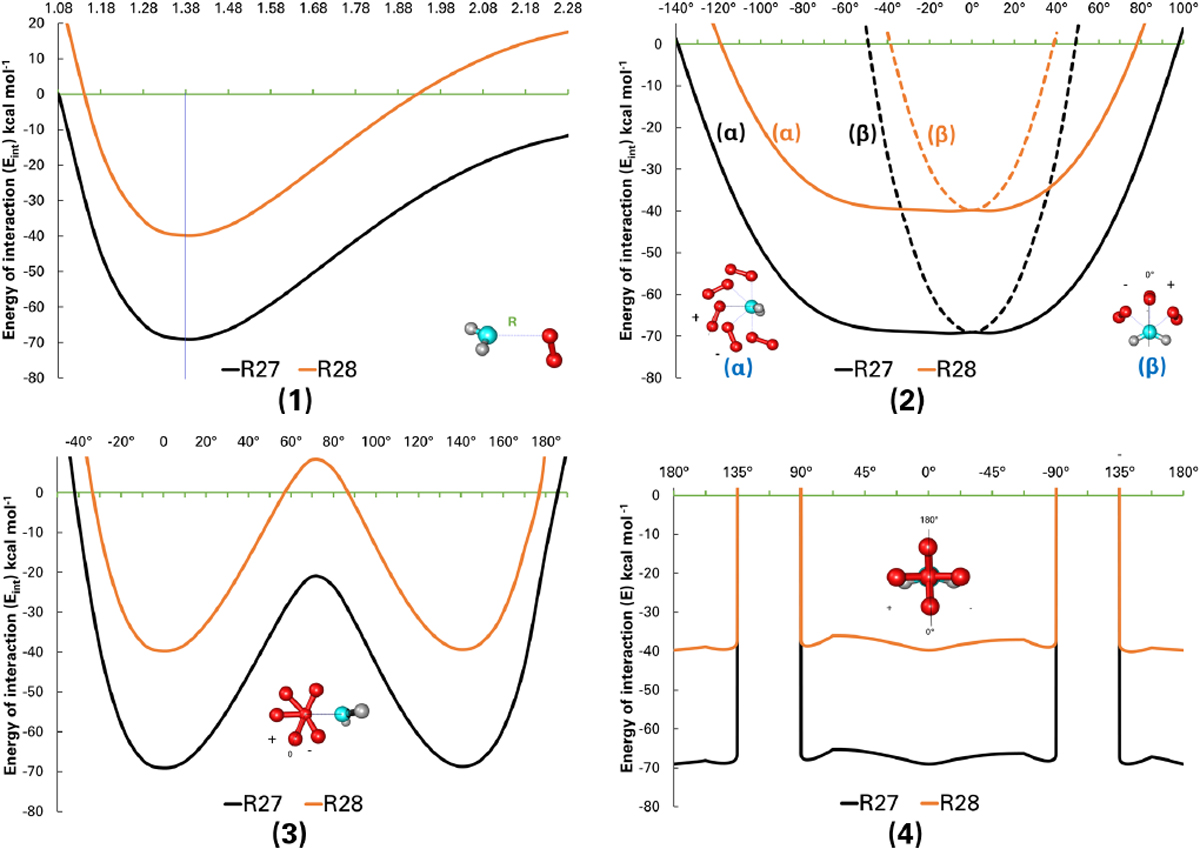
Radial (1) and angular (2), (3), and (4) interaction energy diagrams (Eint) of R27 (black) and R28 (orange) entrance channels. (1) Upright blue bar represent R at the equilibrium. (2) Dotted lines illustrates the entrance energy curve of the angular β anisotropies. Molecular energies were calculated at CCSD(T)-F12/cc-pVTZ-F12, units in kcal mol−1, angles in sexagesimal degrees, and molecular distances in Å.
Current usage metrics show cumulative count of Article Views (full-text article views including HTML views, PDF and ePub downloads, according to the available data) and Abstracts Views on Vision4Press platform.
Data correspond to usage on the plateform after 2015. The current usage metrics is available 48-96 hours after online publication and is updated daily on week days.
Initial download of the metrics may take a while.