Fig. 3
Download original image
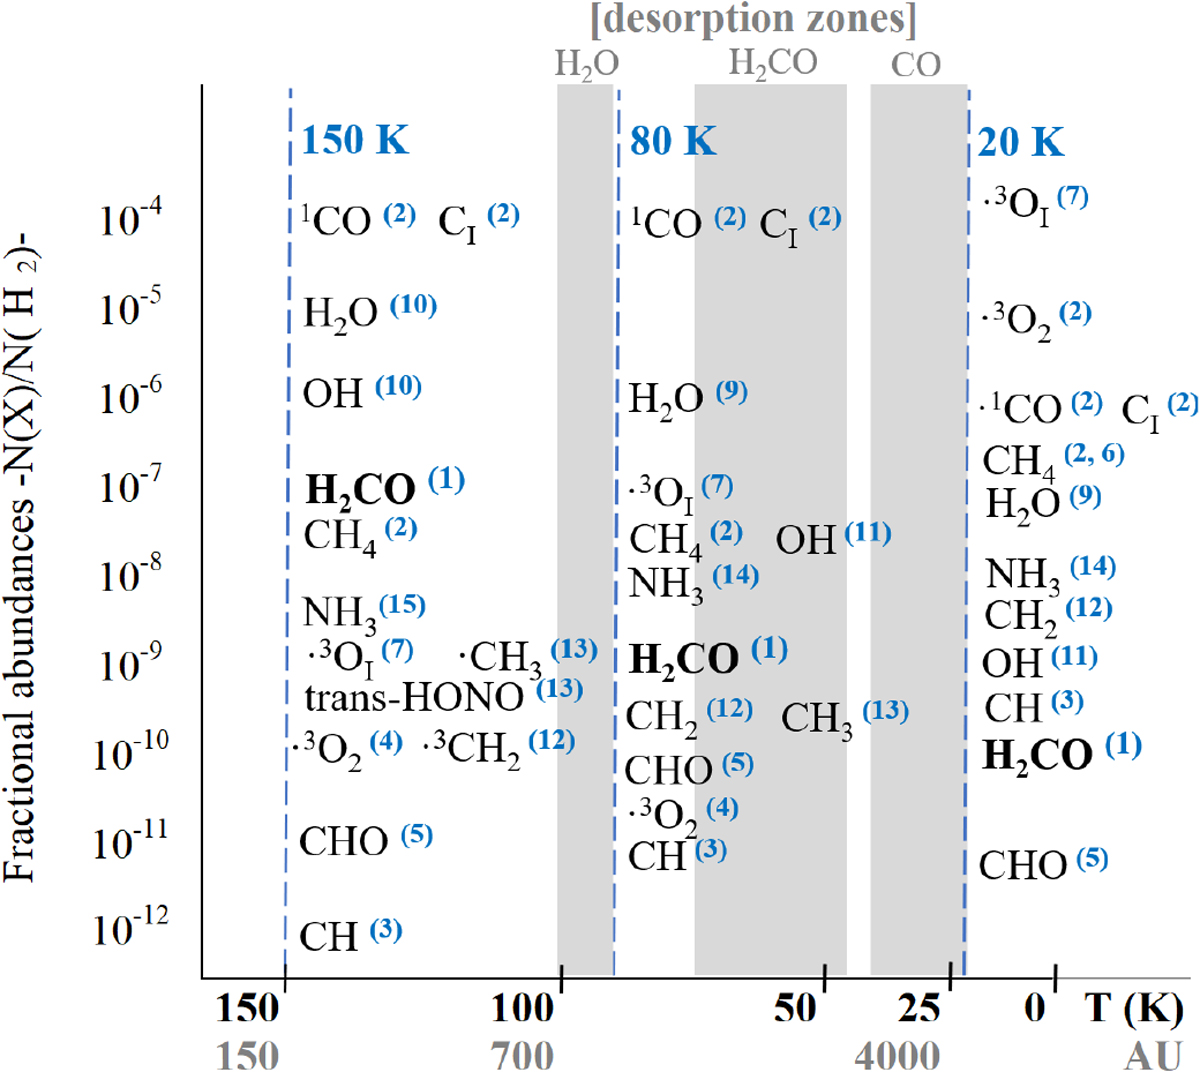
Chemical species and detected fractional abundances in the three studied regions of IRAS 16293. Upright bars in gray correspond to desorption zones of H2 O, H2CO and CO (see text). The temperature is given in K, the molecular density in cm−3, and the distance in AU. References: 1. Ceccarelli et al. (2001). 2. Doty et al. (2004). 3. Bottinelli et al. (2014). 4. Carty et al. (2005). 5. Rivilla et al. (2018). 6. Sakai et al. (2012). 7. Aikawa et al. (2015). 8. Coutens et al. (2019). 9. Crimier et al. (2010). 10. Ceccarelli et al. (1998). 11. Parise et al. (2012). 12. Monte Carlo calculations from Vasyunin & Herbst (2013). 13. Sakai et al. (2012). 14. Hily-Blant et al. (2010). 15. Schwarz & Bergin (2014).
Current usage metrics show cumulative count of Article Views (full-text article views including HTML views, PDF and ePub downloads, according to the available data) and Abstracts Views on Vision4Press platform.
Data correspond to usage on the plateform after 2015. The current usage metrics is available 48-96 hours after online publication and is updated daily on week days.
Initial download of the metrics may take a while.